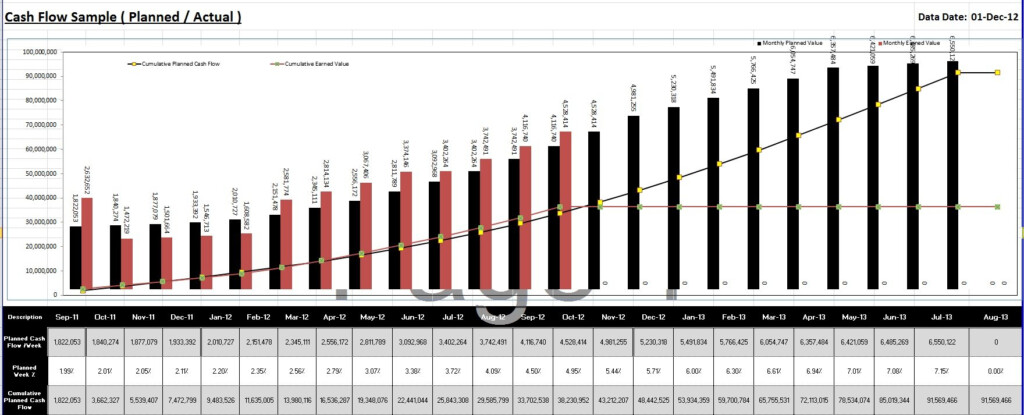
When it comes to financial analysis, one of the most important tools at your disposal is the cumulative cash flow chart. This chart provides a visual representation of the total cash inflows and outflows over a specific period of time, helping you track the overall financial health of your business or investment. In this article, we will dive into the basics of cumulative cash flow charts and how they can benefit your financial decision-making process.
A cumulative cash flow chart is a graphical representation of the cumulative cash flows over time. It shows the running total of cash inflows and outflows, allowing you to see how your cash position is evolving over a specific period. The chart typically starts at zero and moves up or down based on the net cash flow for each period. By analyzing this chart, you can identify trends, patterns, and potential cash flow issues that may require attention.
Cumulative Cash Flow Chart
How to Interpret a Cumulative Cash Flow Chart
Interpreting a cumulative cash flow chart is relatively straightforward. If the chart is moving upward, it indicates a positive cash flow, meaning that your business or investment is generating more cash than it is spending. On the other hand, if the chart is trending downward, it signifies a negative cash flow, suggesting that you are spending more cash than you are bringing in. By monitoring the cumulative cash flow chart regularly, you can make informed decisions to optimize your cash flow management and ensure the financial stability of your venture.
Benefits of Using Cumulative Cash Flow Charts
Cumulative cash flow charts offer several benefits for financial analysis. Firstly, they provide a clear and concise visual representation of your cash flow position, making it easier to identify trends and potential issues. Additionally, these charts help you track the overall financial performance of your business or investment, allowing you to make data-driven decisions to improve profitability and sustainability. By incorporating cumulative cash flow charts into your financial analysis toolkit, you can gain valuable insights into your cash flow dynamics and take proactive measures to enhance your financial well-being.
In conclusion, cumulative cash flow charts are powerful tools that can help you track and analyze your cash flow position effectively. By understanding how to interpret these charts and leveraging the insights they provide, you can make informed decisions to optimize your cash flow management and achieve long-term financial success.
Download Cumulative Cash Flow Chart
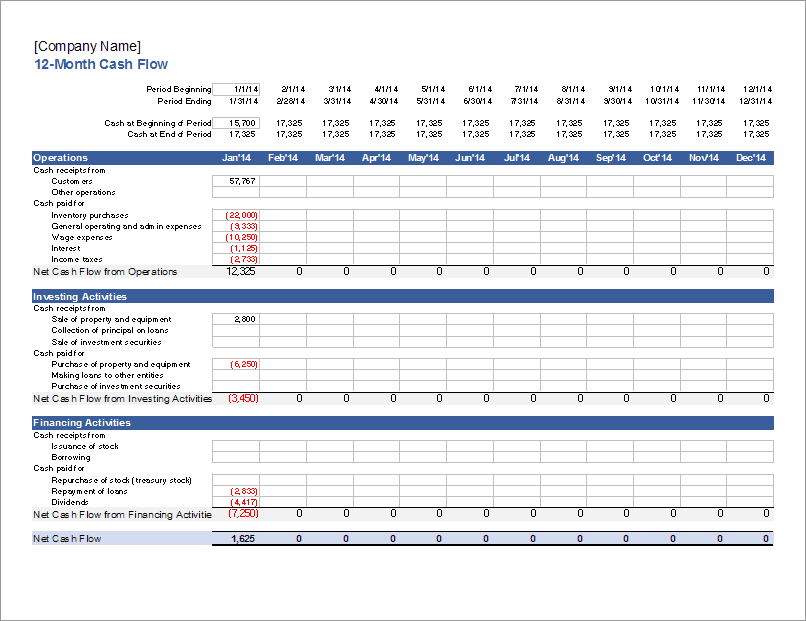
Dentrodabiblia Cash Flow Chart Excel
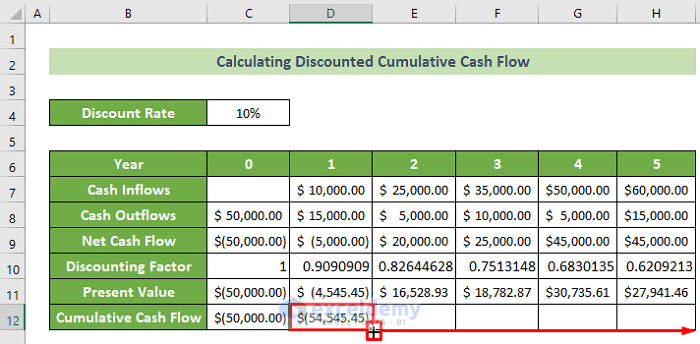
How To Calculate Cumulative Cash Flow In Excel with Quick Steps
How To Calculate Cumulative Cash Flow In Excel with Quick Steps
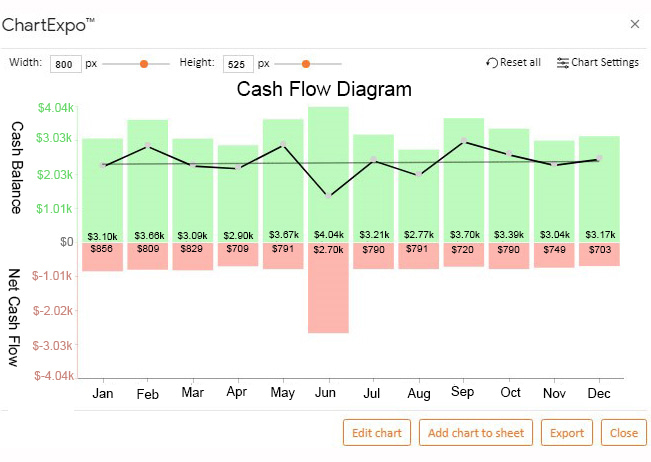
How To Create A Cash Flow Chart Easy To Follow Steps


