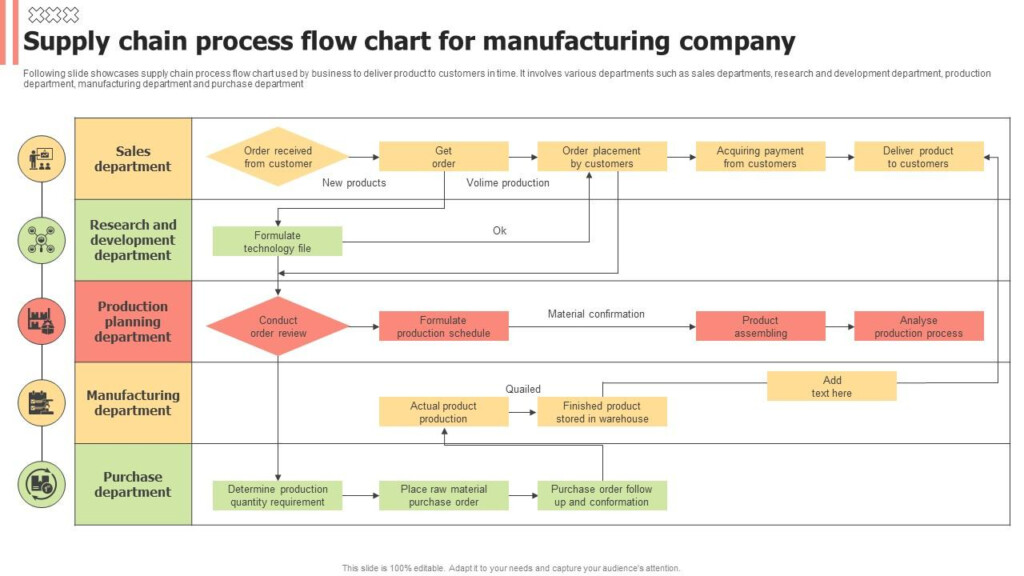
A flow chart is a visual representation of a process or workflow. It uses different shapes and symbols to represent different steps in the process, making it easier to understand and follow. Flow charts are commonly used in various industries such as manufacturing, engineering, project management, and software development to map out complex processes and identify areas for improvement.
By using a flow chart, teams can easily communicate and collaborate on a shared understanding of the process, ensuring that everyone is on the same page. This visual representation helps in identifying bottlenecks, inefficiencies, and potential risks in the process, allowing for better decision-making and optimization of the workflow.
Flow Chart Is Used For
2. Problem Solving and Decision Making
Flow charts are also used for problem-solving and decision-making processes. By breaking down a complex problem or decision into smaller steps, individuals or teams can systematically analyze the situation and determine the best course of action. Flow charts help in organizing thoughts, identifying dependencies, and evaluating different options, leading to more informed and effective decisions.
Moreover, flow charts can be used to create decision trees, where different outcomes are mapped out based on different choices or scenarios. This visual representation allows for a clear understanding of the potential consequences of each decision, helping individuals or teams make risk-aware choices and mitigate potential risks.
3. Process Documentation and Training
In addition to visualizing processes and problem-solving, flow charts are also used for process documentation and training purposes. By documenting a process in a flow chart, organizations can create a standardized procedure that can be easily shared and referenced by employees. This helps in ensuring consistency, efficiency, and quality in the execution of tasks.
Flow charts are also valuable for training new employees or team members on a specific process or workflow. By presenting the information in a visual format, individuals can quickly grasp the sequence of steps and understand the logic behind the process. This accelerates the learning curve and helps in onboarding new team members more effectively.
