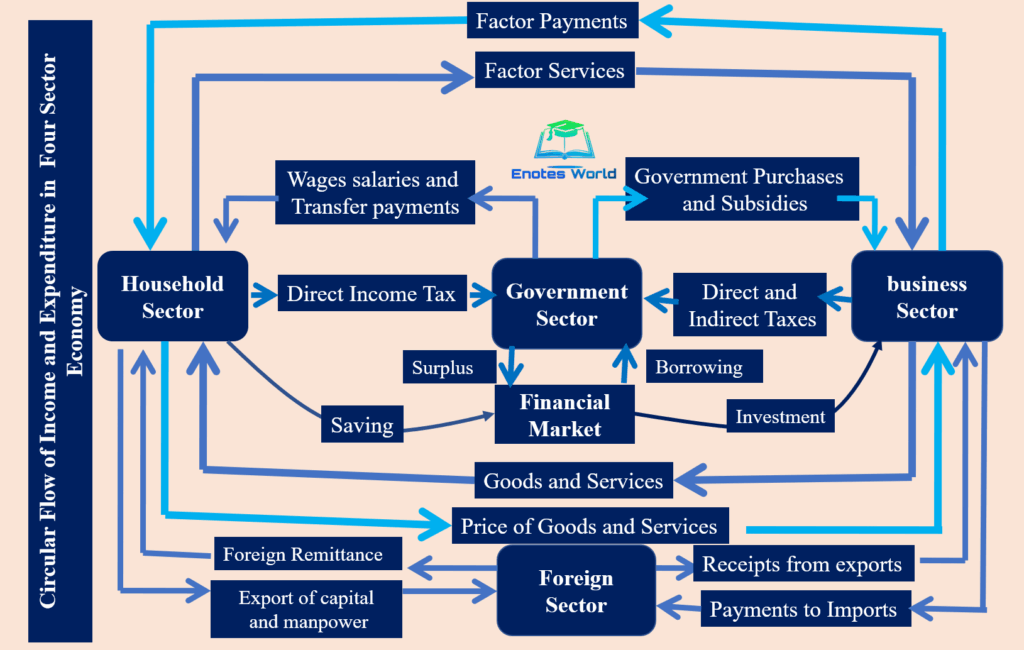
A Circular Flow Chart Model is a visual representation of the flow of goods, services, and money within an economy. It illustrates how households and businesses interact in the market to exchange goods and services for money. The model shows the interconnectedness of the different sectors of the economy and how they rely on each other for economic activity.
In a typical circular flow chart model, there are two main sectors: households and businesses. Households supply factors of production such as labor and capital to businesses in exchange for income. Businesses then use these factors of production to produce goods and services, which they sell to households and other businesses. This cycle continues as money flows from households to businesses and back again, creating a continuous flow of economic activity.
Circular Flow Chart Model
Key Components of a Circular Flow Chart Model
There are several key components in a Circular Flow Chart Model that help to illustrate the dynamics of the economy. These components include:
- Households: Represent individuals or families who supply labor and capital to businesses in exchange for income.
- Businesses: Represent producers who use factors of production to create goods and services for sale.
- Goods and Services: Represent the products produced by businesses and consumed by households.
- Factor Markets: Represent the markets where factors of production are bought and sold.
- Product Markets: Represent the markets where goods and services are bought and sold.
By understanding the Circular Flow Chart Model and its key components, economists and policymakers can analyze the interactions between households and businesses and make informed decisions to promote economic growth and stability.
