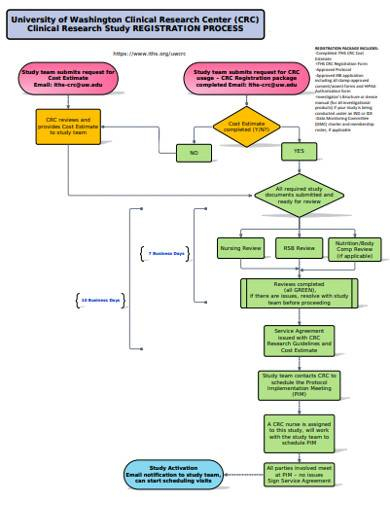
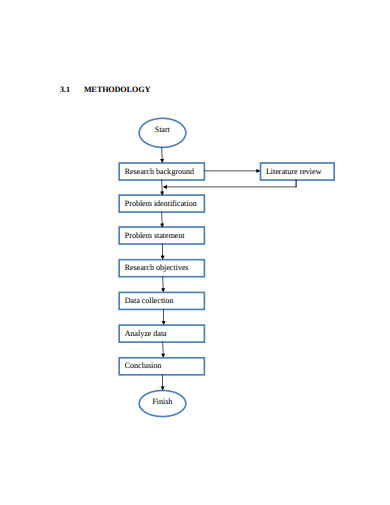
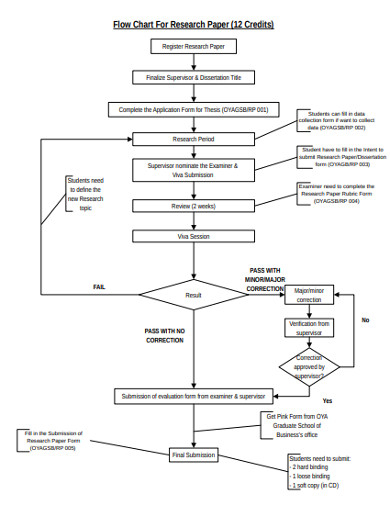
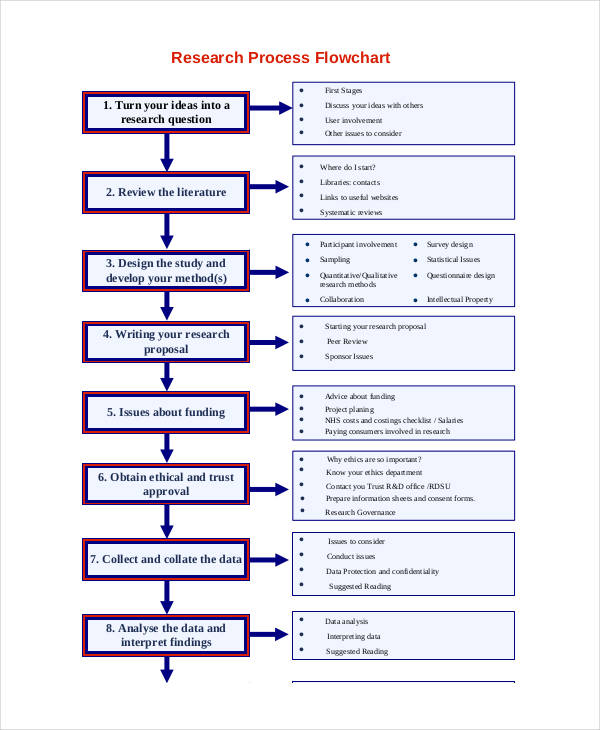
A research flow chart is a visual representation of the steps involved in conducting a research study. It outlines the process from the initial research question to data collection, analysis, and interpretation. Research flow charts help researchers stay organized and ensure that they follow a systematic approach to their study.
Each step in the research flow chart is typically represented by a box or a shape, with arrows indicating the flow of the research process. This visual representation makes it easy to track progress, identify potential bottlenecks, and make adjustments as needed. Research flow charts are commonly used in academic research, but they can also be useful in other fields such as business, healthcare, and social sciences.
Example Of Research Flow Chart
Why Use a Research Flow Chart?
Research flow charts are an essential tool for researchers for several reasons. Firstly, they provide a clear and structured overview of the research process, making it easier to understand and communicate the study’s methodology. This can be particularly helpful when presenting findings to colleagues, supervisors, or other stakeholders.
Secondly, research flow charts help researchers identify potential gaps or errors in their study design. By visually mapping out each step in the research process, researchers can pinpoint areas that may need further clarification or refinement. This can ultimately lead to more robust and reliable research outcomes.
Example of a Research Flow Chart
Let’s take a look at an example of a research flow chart for a hypothetical study on the effects of exercise on mental health:
1. Define research question
2. Conduct a literature review
3. Develop research methodology
4. Obtain ethical approval
5. Recruit study participants
6. Collect data through surveys and interviews
7. Analyze data using statistical software
8. Interpret findings and draw conclusions
9. Write research report
10. Present findings at conferences or publish in academic journals
By following this research flow chart, researchers can ensure that they have a clear roadmap for conducting their study and producing meaningful results.
In conclusion, research flow charts are an invaluable tool for researchers in any field. By visually mapping out the research process, researchers can stay organized, identify potential issues, and communicate their findings effectively. Whether you are a student working on a thesis or a professional conducting a large-scale research project, incorporating a research flow chart into your methodology can help streamline your work and improve the quality of your research outcomes.
Download Example Of Research Flow Chart
FREE 15 Research Flow Chart Samples In MS Word PDF
Research Methodology Flow Chart Pdf Coremymages
Research Methodology Flow Chart Pdf Coremymages
Research Proposal Flow Chart Example A Visual Reference Of Charts
