Circular arrow flow charts are a popular visual tool used to represent processes, cycles, and workflows in a circular manner. They are often utilized in presentations, reports, and diagrams to illustrate the flow of information or steps in a cyclical process. The circular shape of the chart allows for easy visualization of the sequence of events and helps to convey complex concepts in a simple and concise manner.
One of the key features of circular arrow flow charts is that they loop back on themselves, creating a continuous cycle of actions or steps. This makes them ideal for displaying repetitive processes or recurring events. The arrows in the chart indicate the direction of flow, guiding the viewer through the sequence of steps or stages in the process. Circular arrow flow charts can be customized with different colors, shapes, and styles to suit the specific needs of the project.
Circular Arrow Flow Chart
Benefits of Using Circular Arrow Flow Charts
There are several benefits to using circular arrow flow charts in your presentations or reports. Firstly, they provide a clear and visual representation of the flow of information, making it easier for the audience to understand complex concepts. The circular shape of the chart allows for a seamless transition between steps, creating a cohesive and easy-to-follow visual narrative.
Additionally, circular arrow flow charts are versatile and can be used in various contexts, such as project management, process mapping, and decision-making. They can help to identify bottlenecks in a process, highlight areas for improvement, and streamline workflows. By using circular arrow flow charts, you can effectively communicate your ideas and strategies to your audience, ensuring that they grasp the key points and take action accordingly.
Best Practices for Creating Circular Arrow Flow Charts
When creating circular arrow flow charts, it is important to follow some best practices to ensure clarity and effectiveness. Firstly, clearly define the starting point and ending point of the cycle to provide a logical flow of information. Use consistent colors, shapes, and fonts to maintain a cohesive visual style throughout the chart.
Furthermore, label each step or stage in the process with concise and descriptive text to guide the viewer through the flow of information. Avoid cluttering the chart with unnecessary details or information, and focus on highlighting the key steps or actions in the process. By following these best practices, you can create a visually appealing and informative circular arrow flow chart that effectively conveys your message to your audience.
By incorporating circular arrow flow charts into your presentations or reports, you can enhance the visual appeal and clarity of your content, making it easier for your audience to understand complex processes and concepts. Whether you are illustrating a workflow, mapping out a project plan, or presenting data in a cyclical format, circular arrow flow charts are a versatile and effective tool for visual communication.
Download Circular Arrow Flow Chart
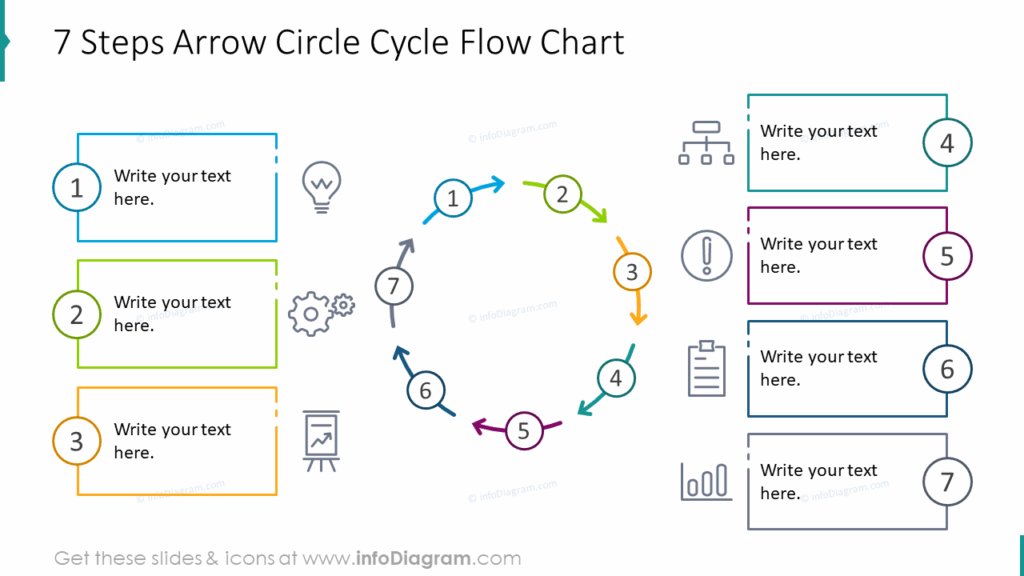
Seven Steps Arrow Circle Cycle Flow Chart
3d Man With Software Development Chart Stock Illustration Image 43782594
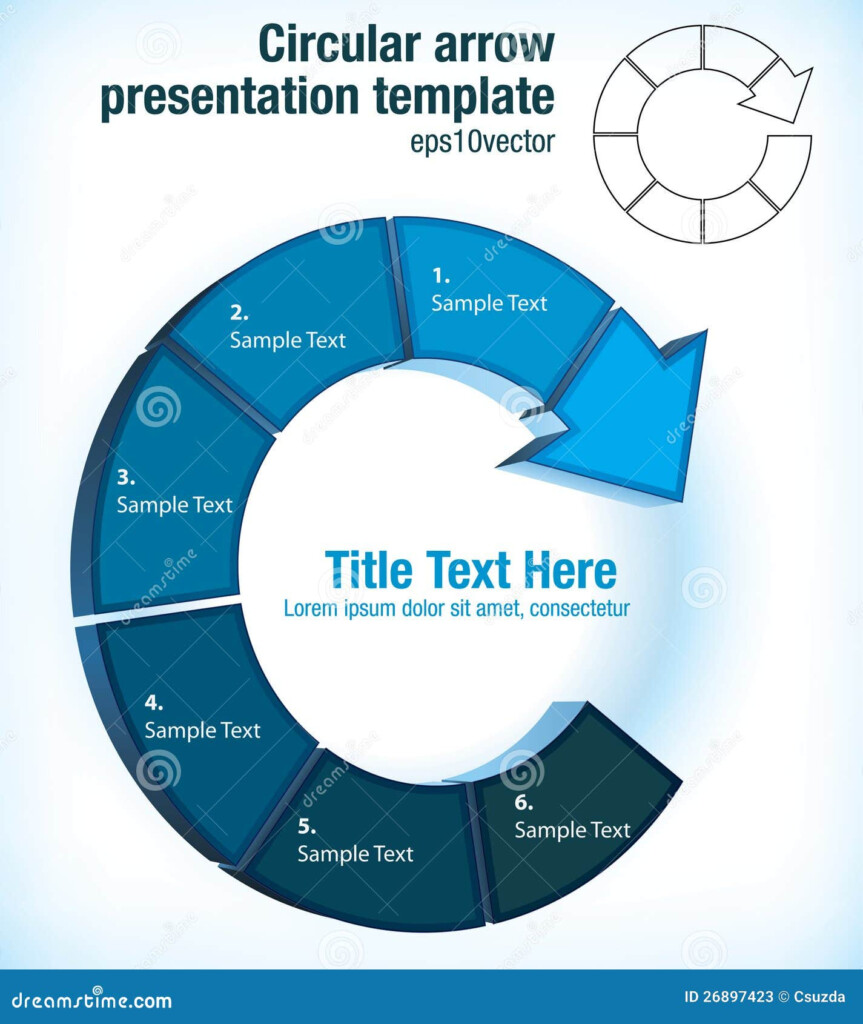
Circular Arrow Pictogram Flow Chart Presentation Template Vector
Circular Arrow Flow Chart PSD Graphicsfuel


