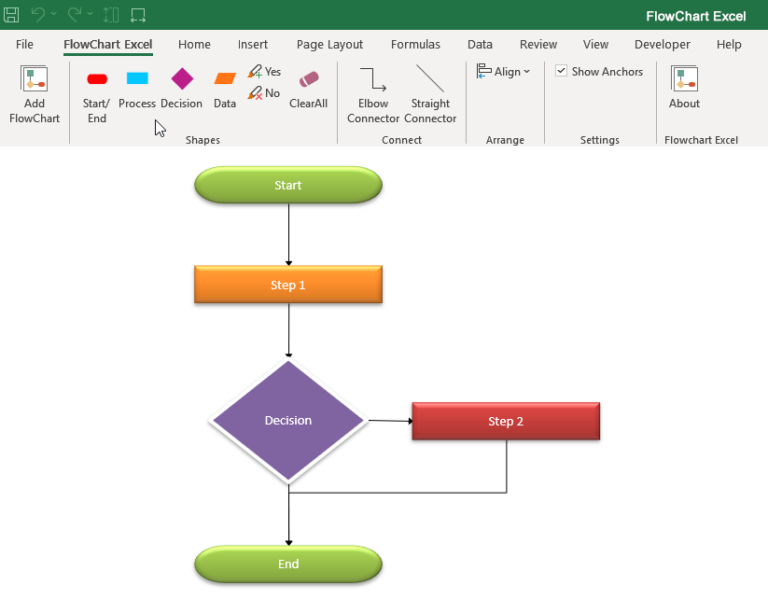
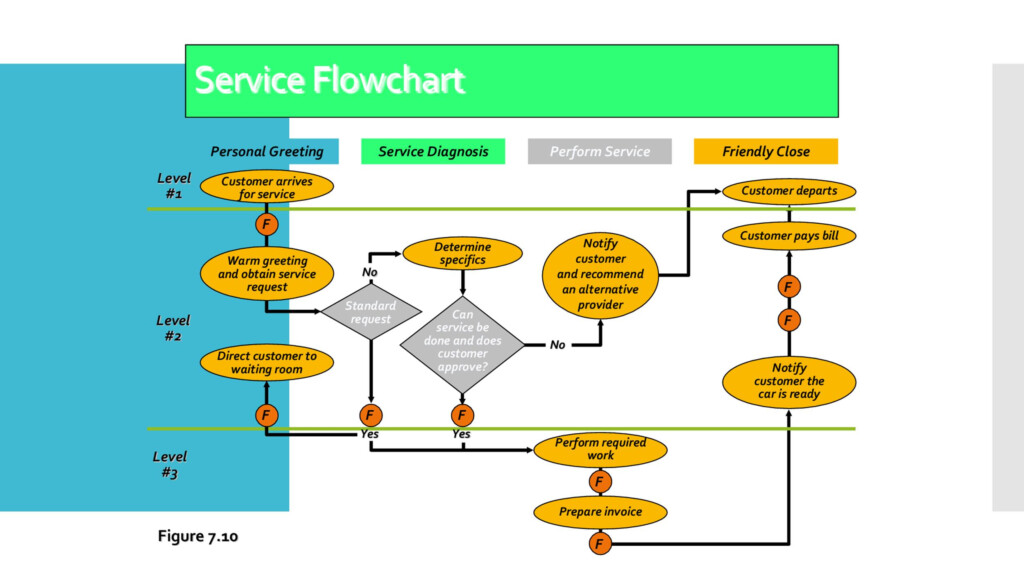
Excel is a powerful tool that can be used for more than just organizing data. By utilizing its features effectively, you can create automated flow charts that streamline your processes and make complex information easier to understand. To start, create a flow chart template in Excel by using shapes and connectors to represent different steps in a process. You can customize the colors and styles of the shapes to make your flow chart visually appealing and easy to follow.
Next, input the data for each step in your process into the corresponding shapes. Excel’s formula capabilities can be used to automatically update the flow chart as data changes, ensuring that it remains accurate and up-to-date. By linking the shapes together with connectors, you can create a dynamic flow chart that visually represents the sequence of steps in your process.
Automated Flow Chart In Excel
Automating Data Entry
One of the key benefits of using Excel for flow charts is the ability to automate data entry. By linking the shapes in your flow chart to specific cells in your spreadsheet, you can automatically update the flow chart as data changes. This not only saves time and reduces the risk of errors, but also ensures that your flow chart remains accurate and reflects the most current information.
Excel also offers the ability to create interactive flow charts that allow users to input data directly into the spreadsheet and see the flow chart update in real-time. This can be particularly useful for collaborative projects or presentations, as it allows for seamless communication and feedback. By utilizing Excel’s automation features, you can create dynamic and interactive flow charts that enhance your processes and improve efficiency.
Enhancing Visualization and Analysis
Excel’s visualization capabilities can also be leveraged to enhance the analysis of your flow charts. By using conditional formatting and data bars, you can highlight key data points and trends in your flow chart, making it easier to identify patterns and make informed decisions. Additionally, Excel’s charting tools can be used to create visual representations of your flow chart data, such as pie charts or bar graphs, that provide additional insights and context.
Overall, using Excel for automated flow charts can greatly improve the efficiency and effectiveness of your processes. By creating dynamic and interactive flow charts, automating data entry, and enhancing visualization and analysis, you can streamline your workflows and make better-informed decisions. With Excel’s powerful features and capabilities, creating automated flow charts has never been easier.
Download Automated Flow Chart In Excel
Automated Flowchart Maker InfinityExcel
Process Flow Chart Template In Excel Riset
Flow Chart Excel Template Flowchart Examples The Best Porn Website
Excel Flow Chart Templates NBKomputer
