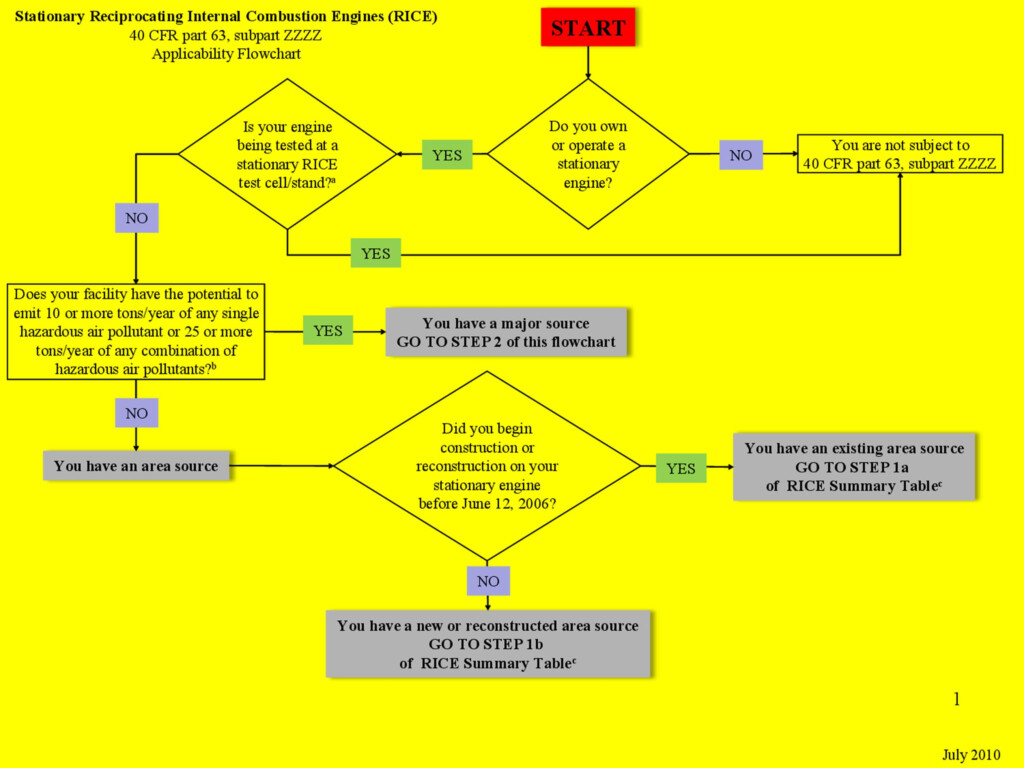
Flow charts are a great way to visually represent a process or workflow. In project management, a flow chart can help teams understand the steps involved in completing a project. For example, a project management flow chart might include steps like project initiation, planning, execution, monitoring, and closing. Each step in the flow chart is represented by a box with arrows connecting them to show the flow of the process.
By using a flow chart, project managers can easily communicate the project timeline, dependencies, and milestones to team members and stakeholders. This visual representation helps everyone involved in the project understand their role and responsibilities, leading to more efficient project completion.
Best Flow Chart Examples
Flow Chart Example 2: Decision Making
Flow charts can also be used in decision-making processes to help individuals or teams make informed choices. For instance, a decision-making flow chart might start with a question like “Should we launch a new product?” with branches leading to different outcomes based on the answer (yes or no). Each outcome is connected to the next step in the decision-making process, guiding users through a series of questions and considerations.
By following a decision-making flow chart, individuals can systematically evaluate the pros and cons of each option, leading to a well-informed decision. This structured approach can reduce biases and ensure that all relevant factors are taken into account before making a final choice.
Flow Chart Example 3: Software Development
Flow charts are commonly used in software development to map out the steps involved in designing, coding, and testing a software application. A software development flow chart might include stages like requirements gathering, design, coding, testing, and deployment. Each stage is represented by a box with arrows indicating the flow of information and tasks between them.
By using a flow chart in software development, developers can visualize the entire development process and identify potential bottlenecks or inefficiencies. This visual representation can help teams prioritize tasks, allocate resources effectively, and ensure that the software project is delivered on time and within budget.
