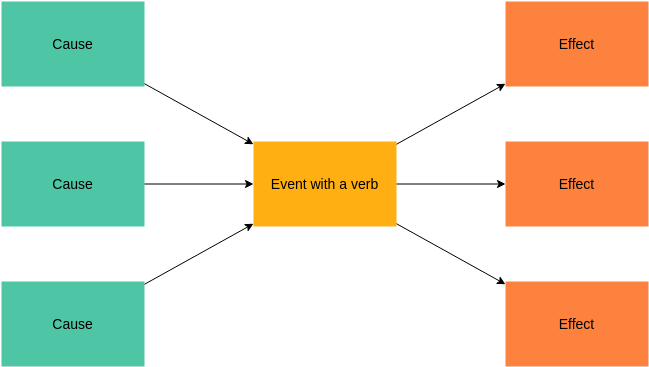
A cause and effect flow chart is a visual representation that illustrates the relationship between various factors and their outcomes. It is a powerful tool used in various fields such as project management, business analysis, and problem-solving. The flow chart helps in identifying the root cause of a problem, understanding the effects of different variables, and mapping out the relationships between them.
Creating a cause and effect flow chart involves identifying the main causes or factors that lead to a particular outcome and then mapping out the relationships between them using arrows and connectors. This visual representation helps in analyzing complex systems and processes, identifying potential bottlenecks, and planning for effective solutions.
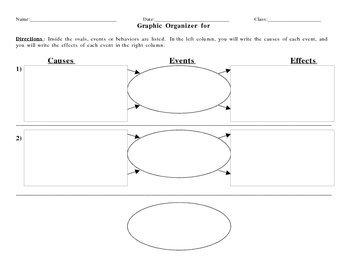
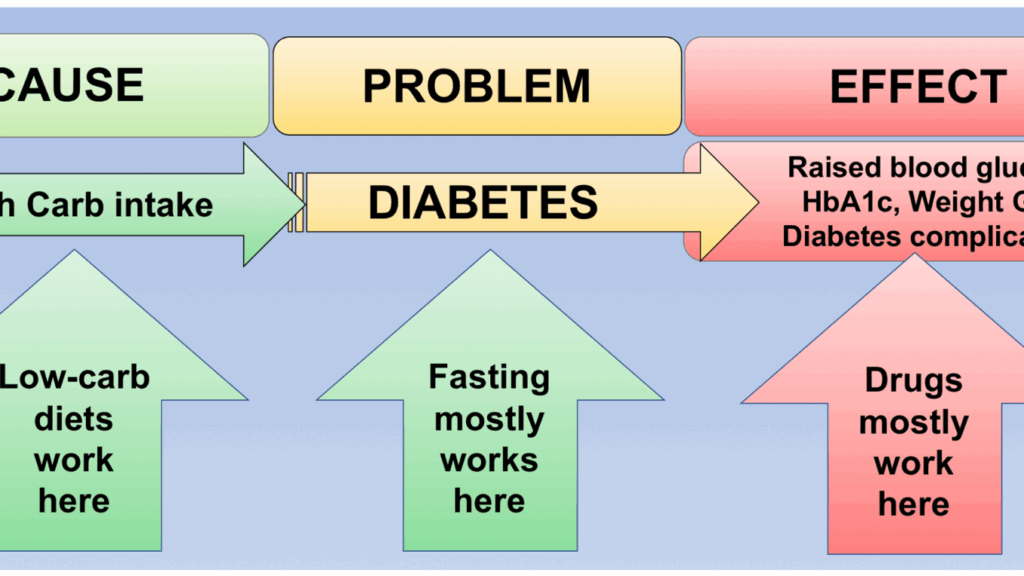
Cause And Effect Flow Chart Example
How to Create a Cause and Effect Flow Chart?
To create a cause and effect flow chart, follow these simple steps:
- Identify the main problem or outcome you want to analyze.
- List down all the possible causes or factors contributing to the problem.
- Draw a box for each cause and connect them using arrows to indicate the relationships.
- Add additional factors or effects as needed to complete the flow chart.
- Review and analyze the flow chart to identify patterns, trends, and potential solutions.
For example, let’s consider a cause and effect flow chart for a decrease in product sales. The main problem is the decrease in sales, and the causes could be poor marketing strategies, economic downturn, or product quality issues. By mapping out these causes and their relationships, you can identify the root cause of the problem and develop strategies to address it effectively.
Example of Cause and Effect Flow Chart
Here is an example of a cause and effect flow chart for a delay in project delivery:

In this flow chart, the main problem is the delay in project delivery, and the causes include resource constraints, scope changes, and communication gaps. By visually representing these factors and their relationships, you can better understand the reasons behind the delay and take corrective actions to ensure timely project completion.
Overall, cause and effect flow charts are valuable tools for analyzing complex problems, identifying root causes, and developing effective solutions. By using visual representations, you can gain insights into the relationships between different factors and make informed decisions to improve outcomes.
Download Cause And Effect Flow Chart Example
Cause And Effect Flow Chart
Cause and Effect Flow Chart By Apollo Blanco On Prezi
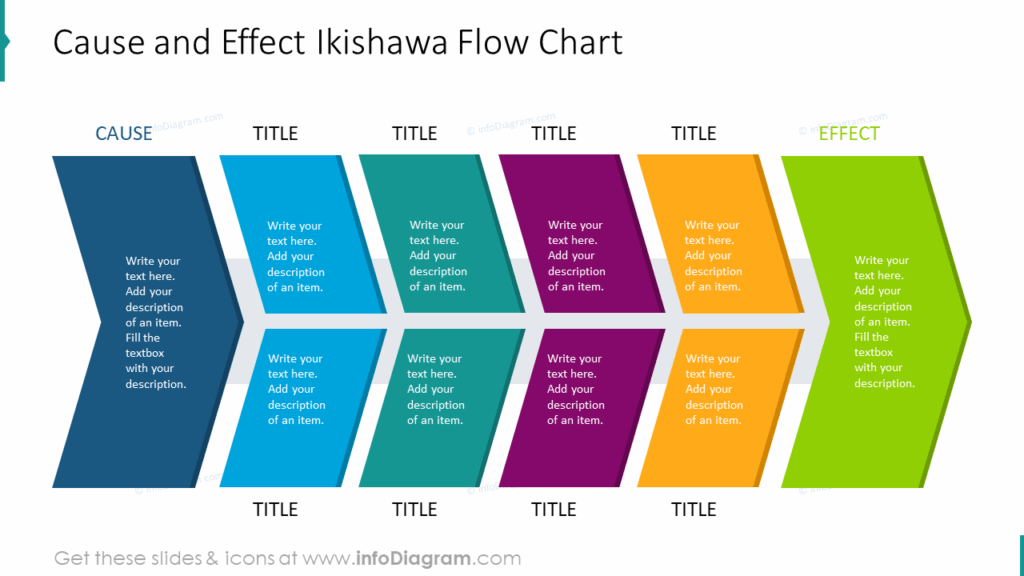
Cause And Effect Ikishawa Flow Chart
Cause And Effect Flow Chart
