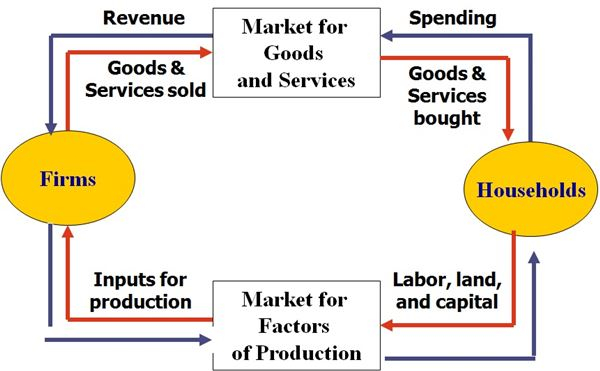
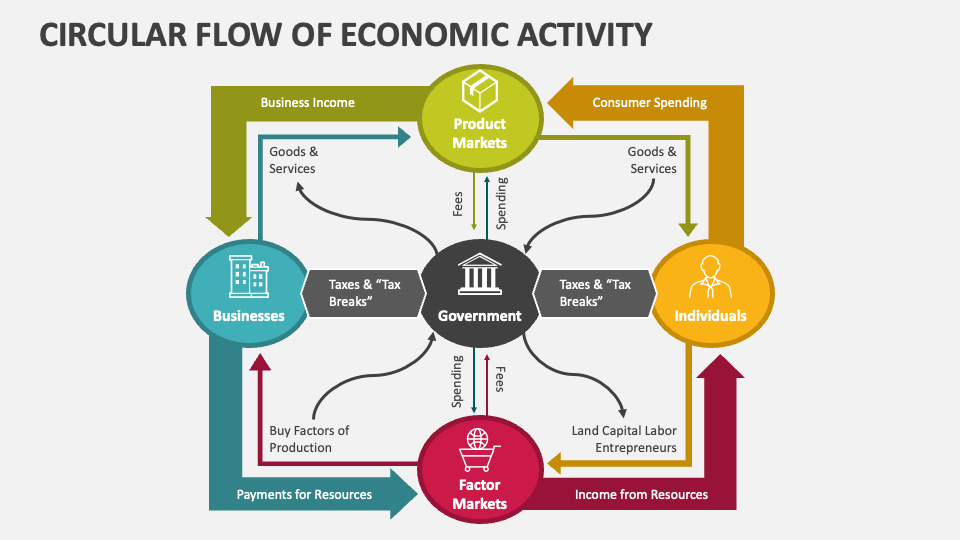
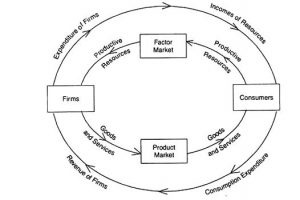
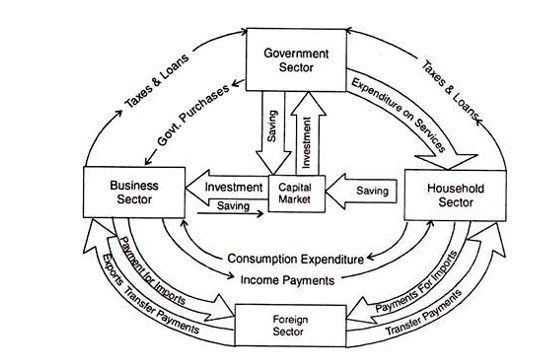
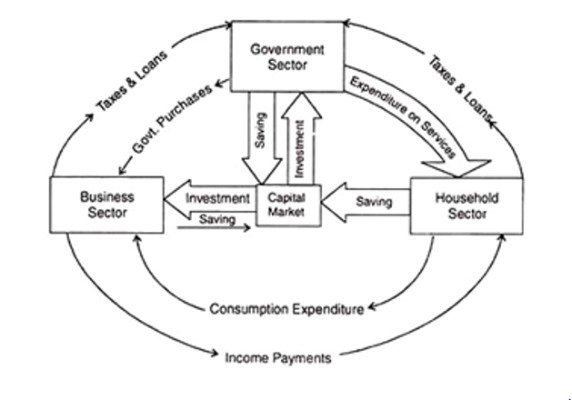
The Circular Flow of Economic Activity Chart is a visual representation of how money, goods, and services flow within an economy. It illustrates how households, businesses, and the government interact with each other through various economic transactions. The chart typically consists of two main sectors – the household sector and the business sector – connected by flows of money and resources.
In the chart, households are shown as consumers who provide labor and capital to businesses in exchange for wages and profits. Businesses, on the other hand, produce goods and services using these resources and sell them to households in exchange for money. The government sector may also be included in the chart to represent its role in collecting taxes and providing public goods and services.
Circular Flow Of Economic Activity Chart
Key Components of the Circular Flow of Economic Activity Chart
There are several key components that make up the Circular Flow of Economic Activity Chart. These include:
1. Households: Represented as consumers who provide labor and capital to businesses.
2. Businesses: Represented as producers who use resources from households to produce goods and services.
3. Goods and Services: Represented as the products exchanged between households and businesses in return for money.
4. Money Flows: Represented as the flow of money from households to businesses in exchange for goods and services, and from businesses to households in the form of wages and profits.
5. Resource Flows: Represented as the flow of resources such as labor and capital from households to businesses for production.
Understanding the Importance of the Circular Flow of Economic Activity Chart
The Circular Flow of Economic Activity Chart is a crucial tool for understanding how different sectors of the economy interact and how economic activity is generated. By visualizing the flow of money, goods, and services, policymakers, economists, and businesses can gain insights into the functioning of the economy and make informed decisions about resource allocation, production, and consumption.
Overall, the Circular Flow of Economic Activity Chart provides a simplified yet comprehensive view of the complex web of economic transactions that drive economic growth and development. It serves as a foundation for economic analysis and helps individuals grasp the interconnectedness of various economic agents in the economy.
Download Circular Flow Of Economic Activity Chart
Circular Flow Of Economic Activity PowerPoint Presentation Slides PPT
Circular Flow Of Economic Activity EconTips
Circular Flow Of Economic Activity EconTips
Circular Flow Of Economic Activity EconTips
