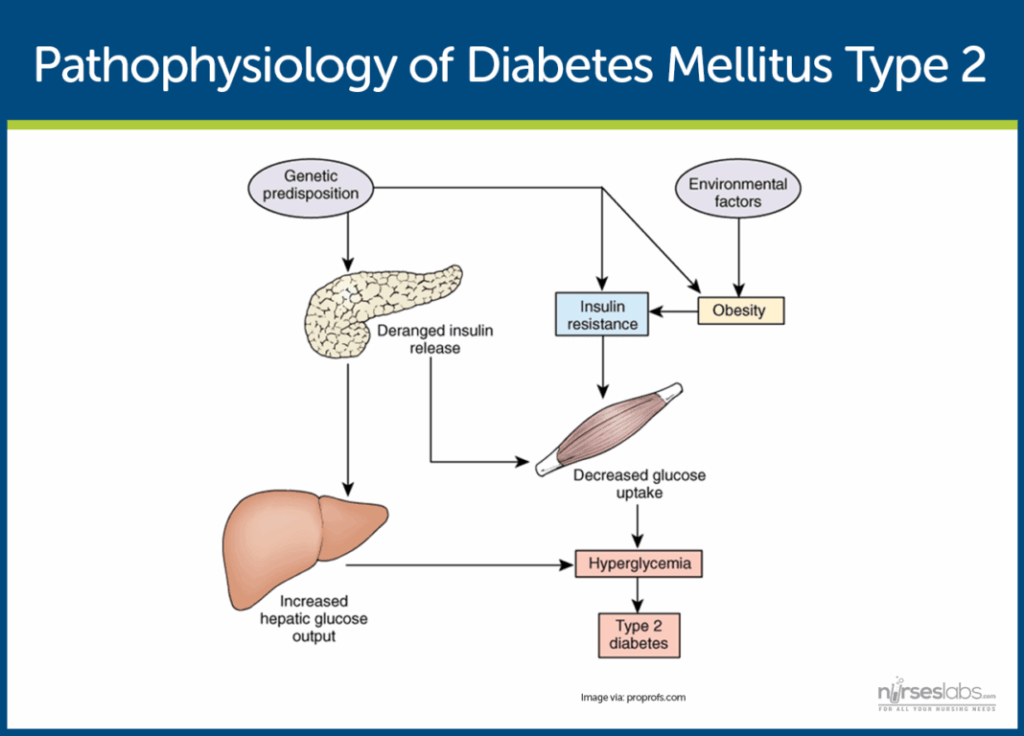
Diabetes Mellitus is a chronic metabolic disorder characterized by high blood sugar levels resulting from defects in insulin secretion, insulin action, or both. To better understand the pathophysiology of Diabetes Mellitus, let’s take a closer look at the key mechanisms involved.
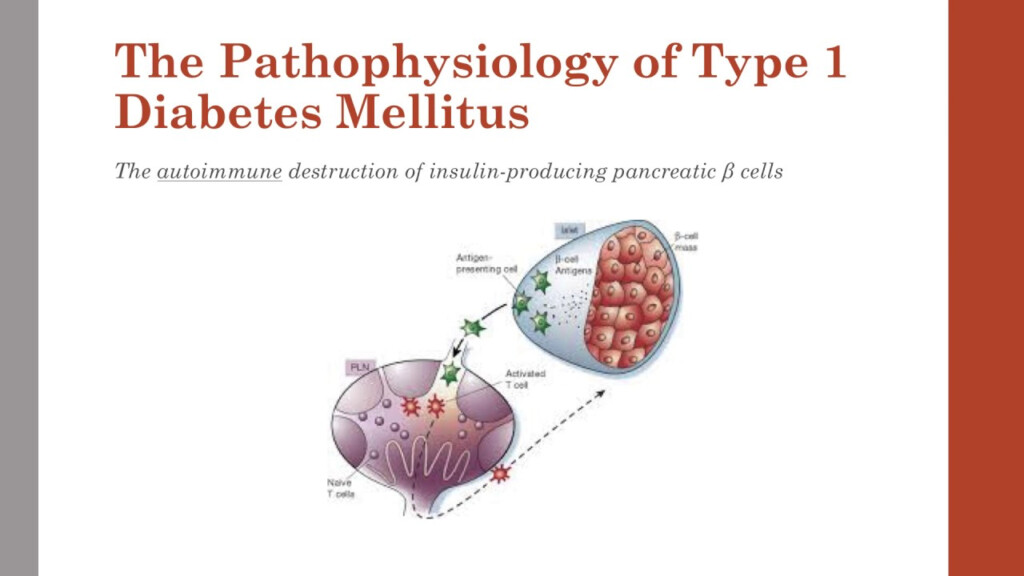
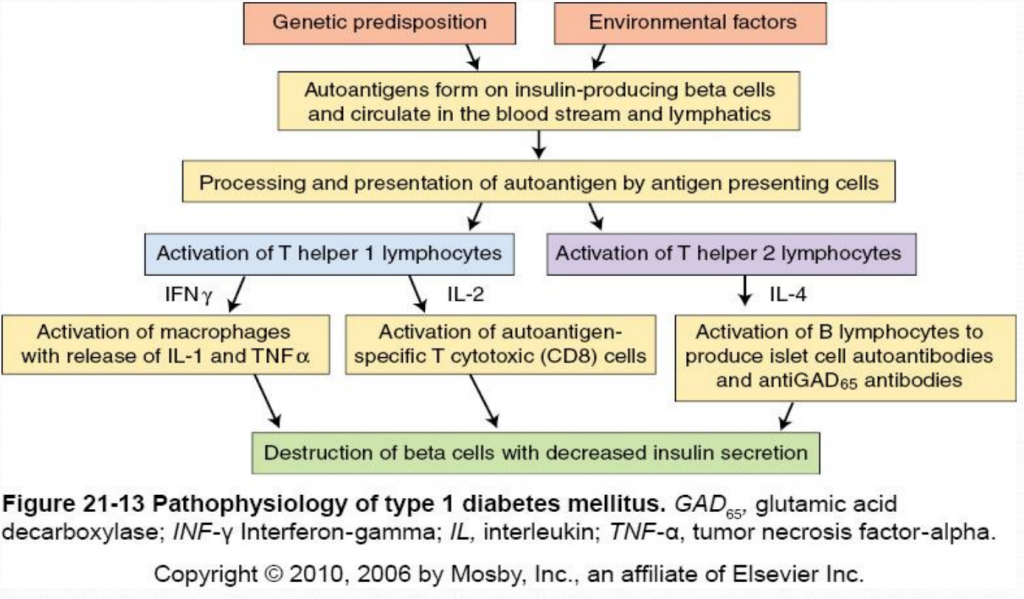
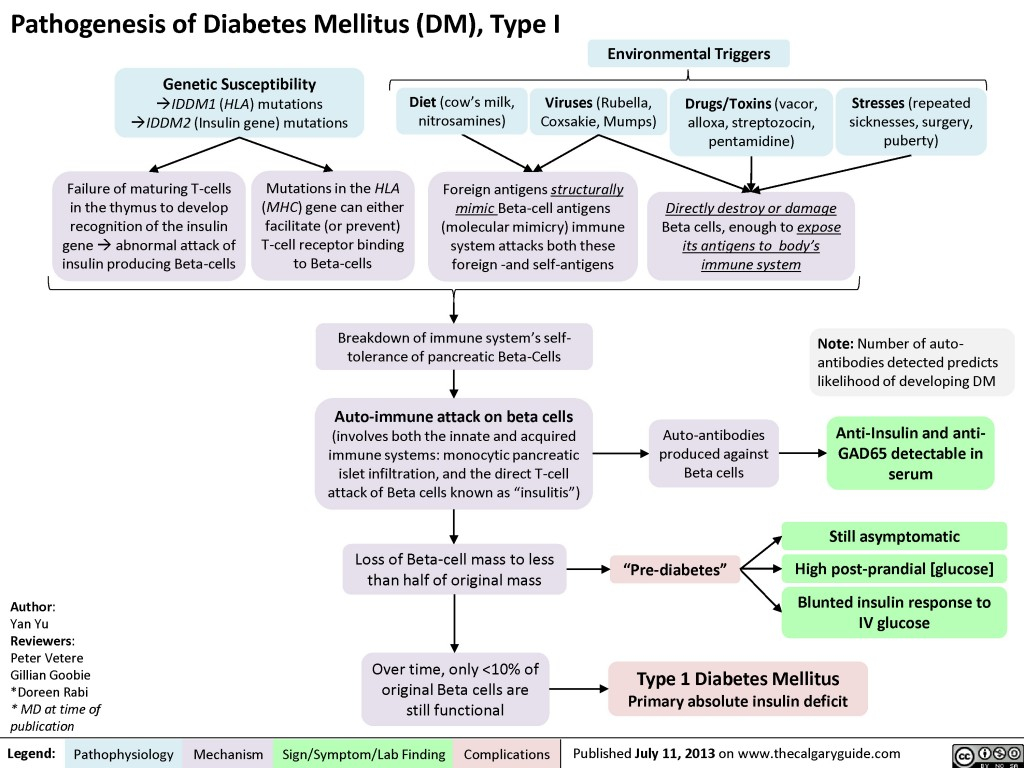
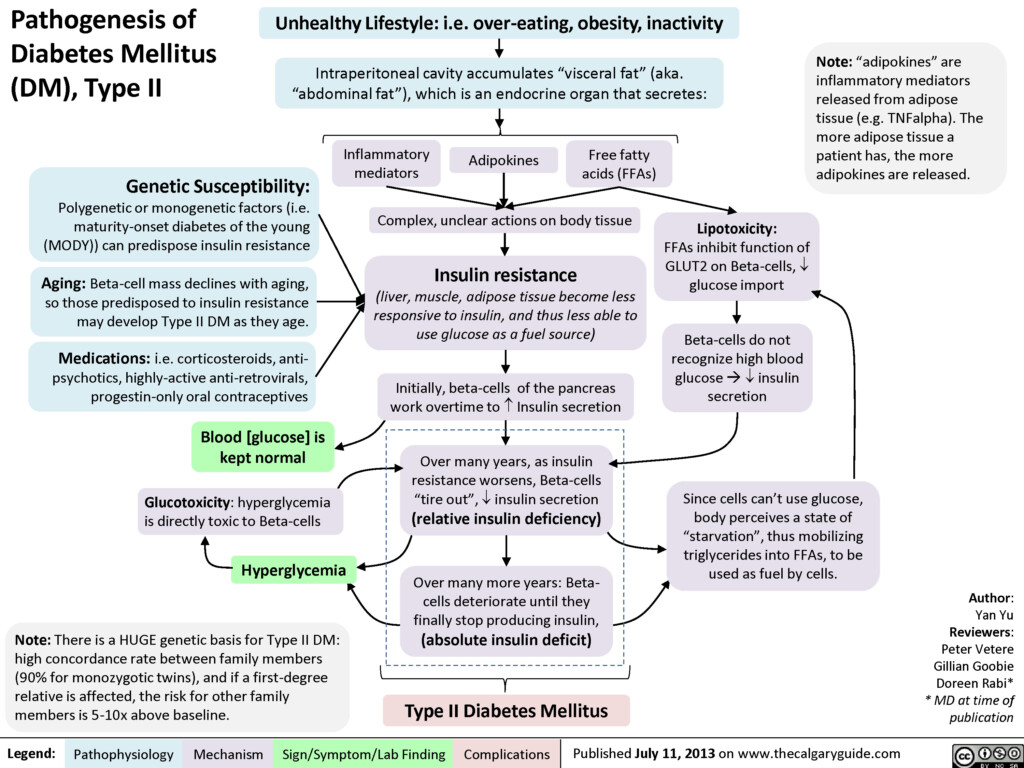
Insulin is a hormone produced by the beta cells of the pancreas and is responsible for regulating blood sugar levels. In individuals with Type 1 Diabetes Mellitus, the immune system mistakenly attacks and destroys the beta cells, leading to a lack of insulin production. This results in uncontrolled high blood sugar levels. On the other hand, in Type 2 Diabetes Mellitus, the body becomes resistant to the effects of insulin, leading to insufficient insulin secretion to maintain normal blood sugar levels.
Diabetes Mellitus Pathophysiology Flow Chart
Glucose Transport and Utilization
Once insulin is released into the bloodstream, it helps transport glucose from the blood into the body’s cells, where it is used for energy production. In Diabetes Mellitus, the impaired insulin action results in decreased glucose uptake by the cells, leading to elevated blood sugar levels. This can lead to various complications such as damage to blood vessels, nerves, and organs over time.
Complications of Diabetes Mellitus
Uncontrolled Diabetes Mellitus can lead to various complications, including cardiovascular disease, kidney failure, nerve damage, and vision problems. It is essential for individuals with Diabetes Mellitus to manage their condition through lifestyle modifications, medication, and regular monitoring of blood sugar levels to prevent or delay these complications.
Creating a Diabetes Mellitus Pathophysiology Flow Chart
Start with the Insulin Production and Secretion
Begin your flow chart by illustrating the normal process of insulin production by the beta cells of the pancreas and its release into the bloodstream. Then, show how this process is disrupted in Type 1 and Type 2 Diabetes Mellitus, leading to high blood sugar levels.
Visualize the Glucose Transport and Utilization
Next, depict how insulin helps transport glucose into the cells for energy production in a healthy individual. Show how insulin resistance or deficiency in Diabetes Mellitus impairs this process, resulting in elevated blood sugar levels and cellular dysfunction.
By creating a comprehensive Diabetes Mellitus Pathophysiology Flow Chart, you can visually represent the key mechanisms involved in the development and progression of this chronic metabolic disorder, aiding in better understanding and management of the condition.
Download Diabetes Mellitus Pathophysiology Flow Chart
Pathophysiology And Clinical Presentation Type 1 Diabetes Mellitus
Pathogenesis Of Diabetes Mellitus DM Type I Calgary Guide
Pathogenesis Of Diabetes Mellitus DM Type II Calgary Guide
Diabetes Mellitus Nursing Care Management
