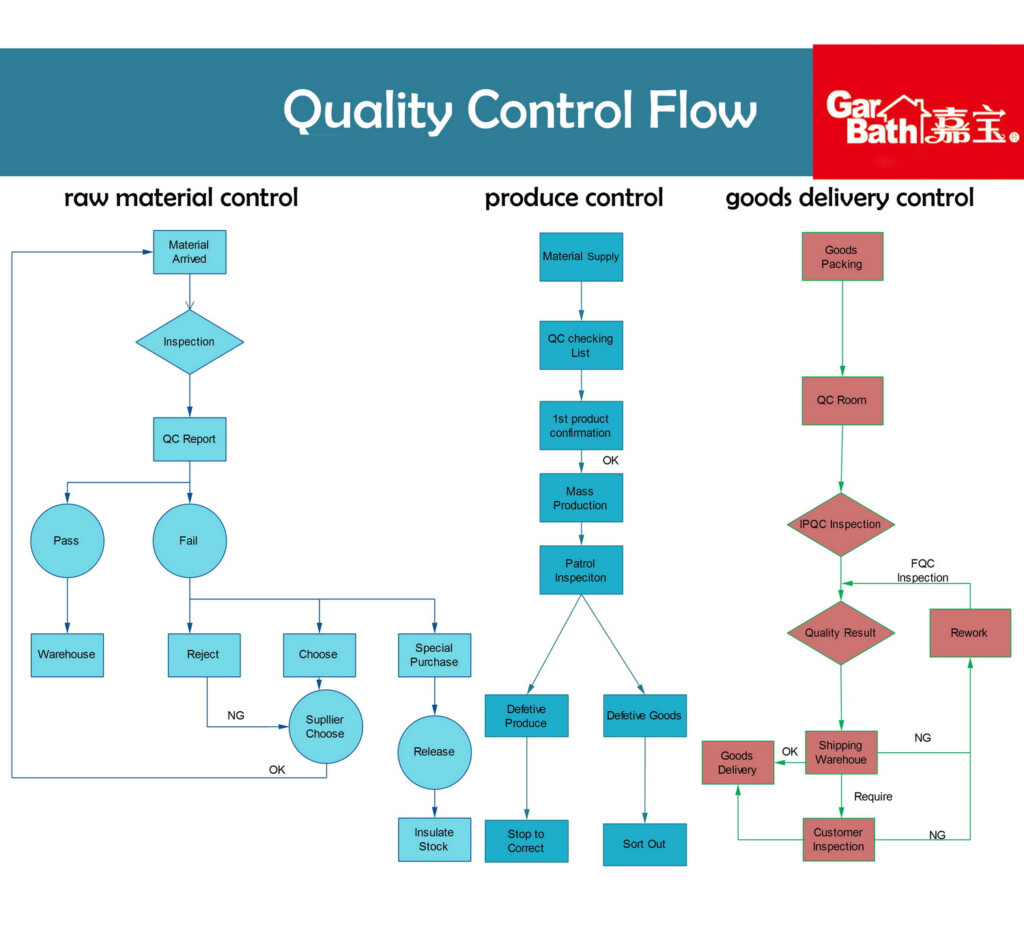
When it comes to visualizing processes and workflows, two commonly used tools are process flow charts and process flow diagrams. While they may seem similar at first glance, there are key differences between the two that are important to understand. Let’s take a closer look at each and explore how they differ.
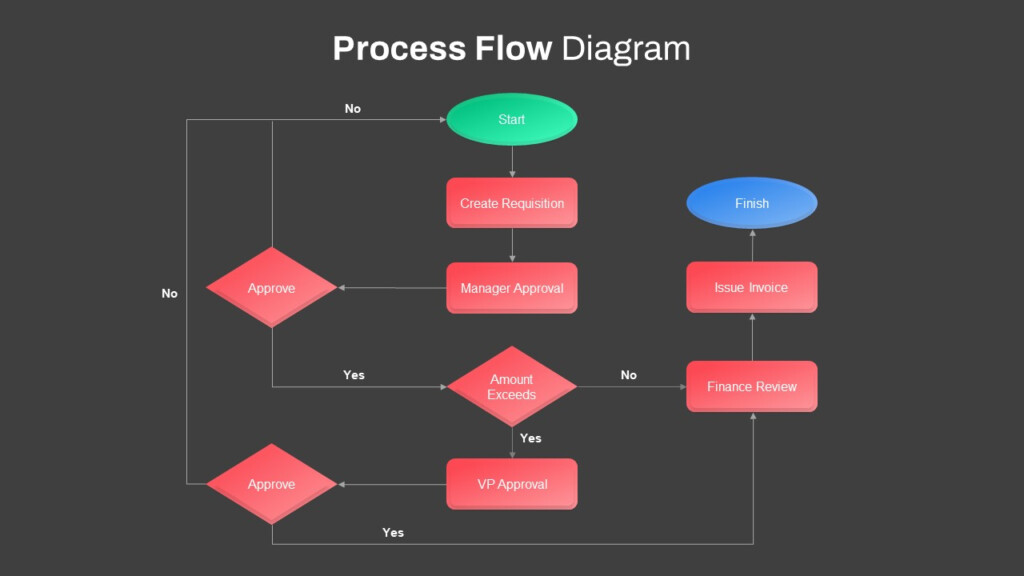
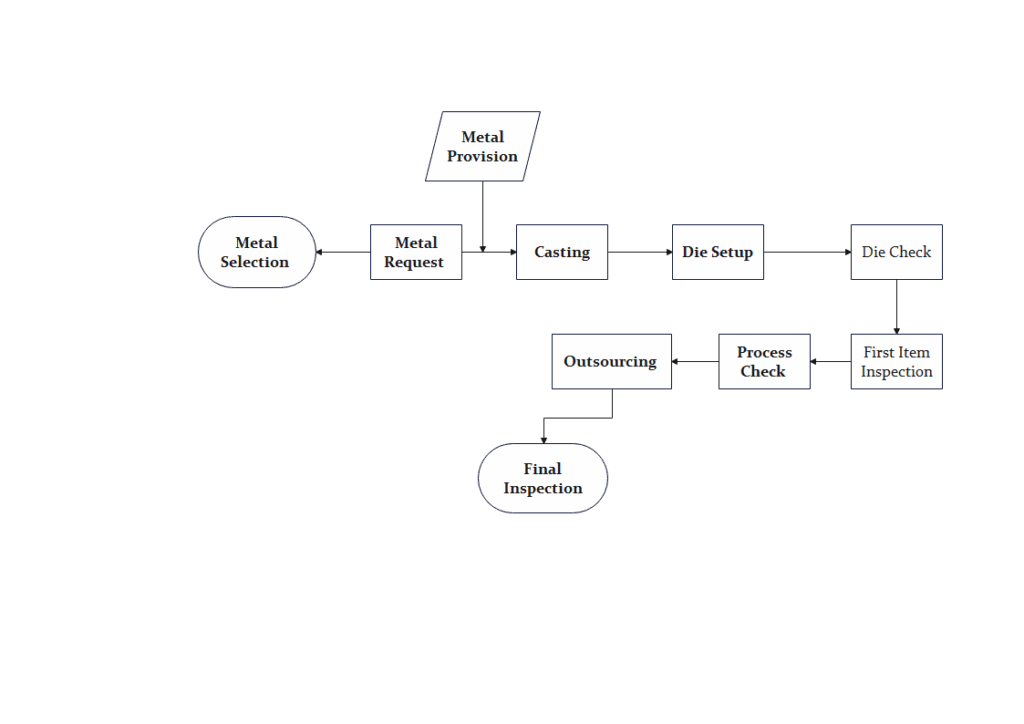
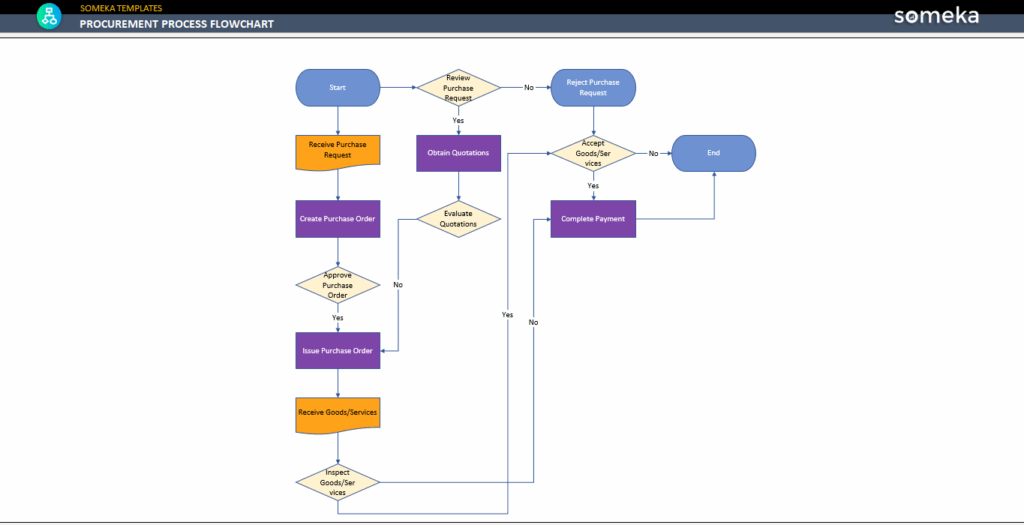
A process flow chart is a visual representation that outlines the steps in a process or workflow. It typically uses symbols and shapes to represent each step, along with arrows to show the flow of the process. Process flow charts are often used to map out the sequence of activities and decision points in a process, making it easier to identify inefficiencies and bottlenecks.
Difference Between Process Flow Chart And Process Flow Diagram
One key feature of a process flow chart is that it focuses on the sequential order of activities and how they are interconnected. This makes it a useful tool for understanding the overall flow of a process and identifying areas for improvement. Process flow charts are commonly used in various industries, such as manufacturing, healthcare, and project management.
Process Flow Diagram
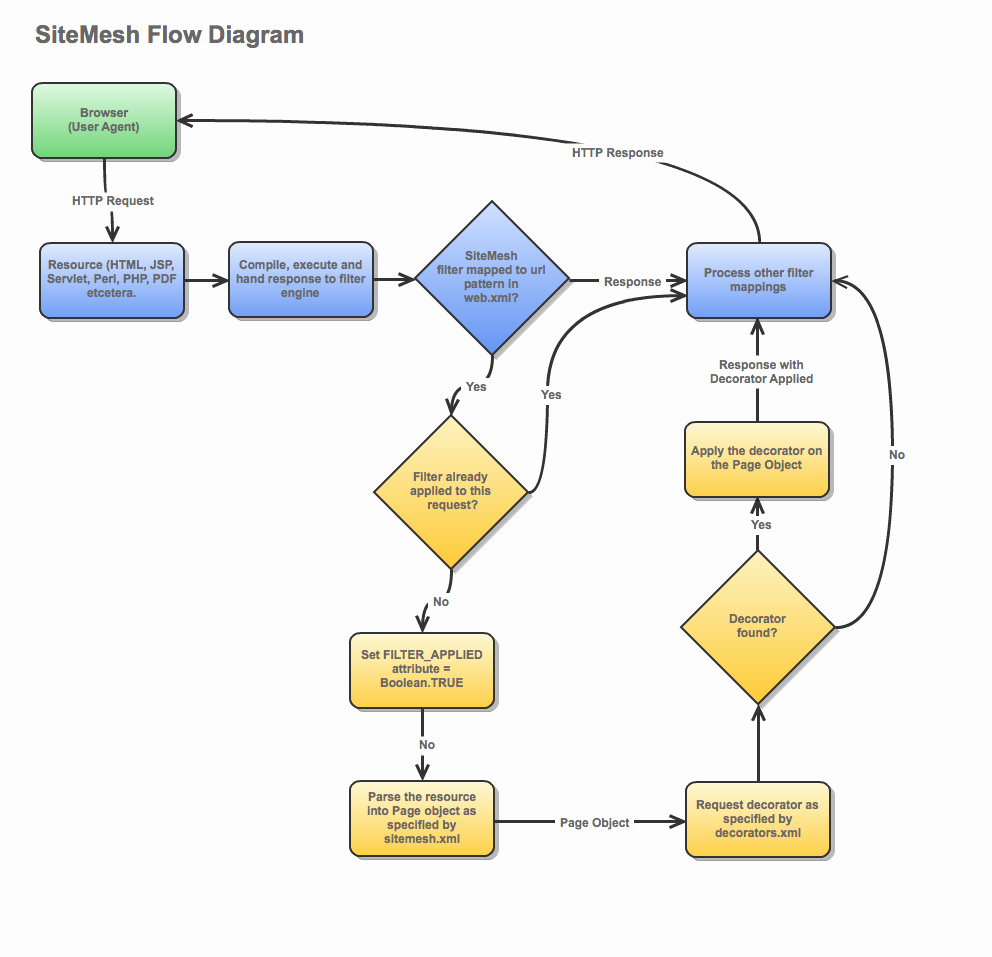
A process flow diagram, on the other hand, is a more detailed visualization of a process that includes additional information such as data inputs, outputs, and resources. It provides a more comprehensive view of the process, showing not only the sequence of steps but also the relationships between different elements of the process.
Process flow diagrams are often used to analyze complex processes and systems, as they allow for a more in-depth understanding of how various components interact with each other. They are particularly useful for identifying potential risks, dependencies, and opportunities for optimization. Process flow diagrams are commonly used in engineering, software development, and business analysis.
Conclusion
In summary, while both process flow charts and process flow diagrams serve the purpose of visualizing processes and workflows, they differ in terms of their level of detail and complexity. Process flow charts focus on the sequential order of activities, while process flow diagrams provide a more comprehensive view of the process, including additional information such as data inputs and outputs. Understanding the differences between these two tools can help you choose the most appropriate visualization method for your specific needs.
Remember, whether you’re using a process flow chart or a process flow diagram, the goal is to improve efficiency, identify opportunities for optimization, and ultimately enhance the overall performance of your processes. Choose the right tool for the job and start visualizing your workflows today!
Download Difference Between Process Flow Chart And Process Flow Diagram
Using A Detailed Flow Chart Trace The Path Of The Compounds Provided
DIAGRAM Data Flow Vs Process Flow Diagram MYDIAGRAM ONLINE
Process Flow Diagram Template Examples Symbols PFD 58 OFF
Flow Chart In Qc Tools Process Flow Diagram Explained With Examples
