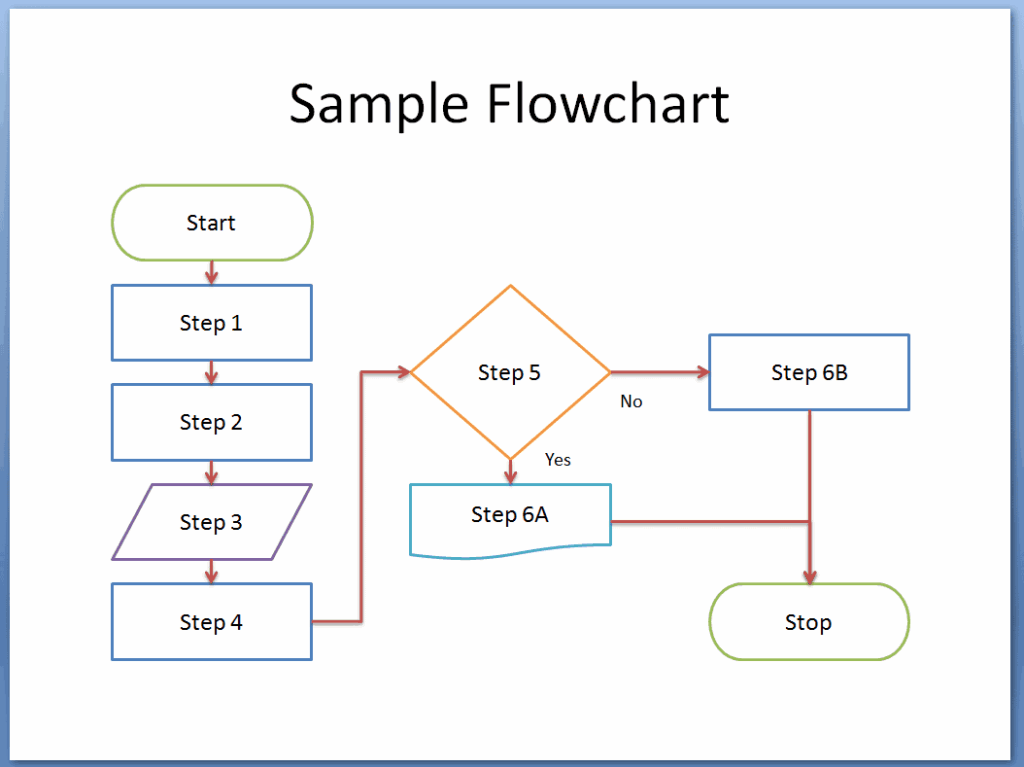
Easy Flow Charts In Excel
With Excel being a powerful tool for creating data visualizations, flow charts can be easily created to represent processes, workflows, and decision trees. In this article, we will guide you on how to create easy flow charts in Excel using simple steps and techniques.
### Getting Started with Flow Charts in Excel
To start creating a flow chart in Excel, you can use shapes and connectors to illustrate the flow of a process. Begin by selecting the “Insert” tab on the Excel ribbon, then click on the “Shapes” option. Choose a shape that represents the starting point of your flow chart, such as a rectangle for a process or a diamond for a decision point. Drag and drop the shape onto the Excel worksheet to create the first step of your flow chart.
Next, add additional shapes to represent the subsequent steps in the process. To connect the shapes, select the “Insert” tab again and click on the “Shapes” option. Choose a connector line that best fits the flow of your process, such as a straight line or an arrow. Drag the connector line from one shape to another to show the sequence of steps in your flow chart.
### Formatting and Customizing Your Flow Chart
Once you have created the basic structure of your flow chart, you can customize it to make it more visually appealing and easier to understand. To format the shapes in your flow chart, right-click on a shape and select the “Format Shape” option. You can change the fill color, outline color, and font style of the shape to differentiate between different steps in the process.
To add text to the shapes in your flow chart, simply double-click on a shape and type in the relevant information. You can also add additional information, such as labels or descriptions, to further clarify each step in the process. By customizing the appearance and content of your flow chart, you can create a clear and easy-to-follow visualization of your process.
### Finalizing Your Flow Chart in Excel
To finalize your flow chart in Excel, you can add titles, legends, and other annotations to provide context and explanations for the process being depicted. You can also resize and reposition the shapes and connectors to make the flow chart more compact and visually appealing. Once you are satisfied with the layout and design of your flow chart, you can save it as a separate file or embed it in a report or presentation.
In conclusion, creating easy flow charts in Excel is a simple and effective way to visualize processes and workflows. By following the steps outlined in this article, you can create professional-looking flow charts that communicate complex information in a clear and concise manner. Whether you are a beginner or an experienced Excel user, flow charts can help you streamline your work and improve your decision-making processes.
Download Easy Flow Charts In Excel
How To Create A Process Flow Chart In Excel Design Talk
Process Flow Chart Template In Excel Riset
Easy Flow Charts Flow Chart Template In 2021
Flow Chart Excel Template Process Map Vs Flowchart
