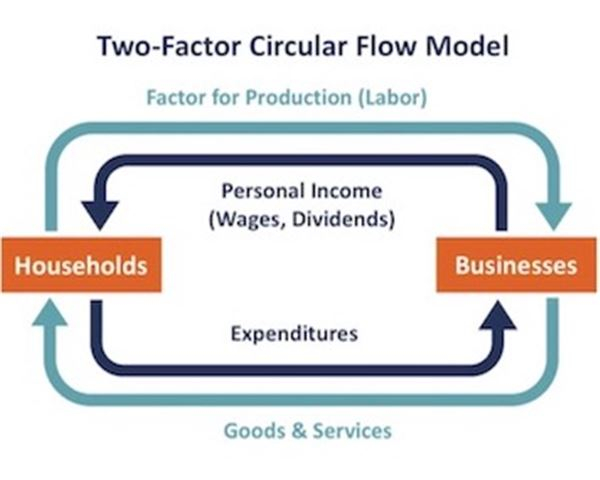
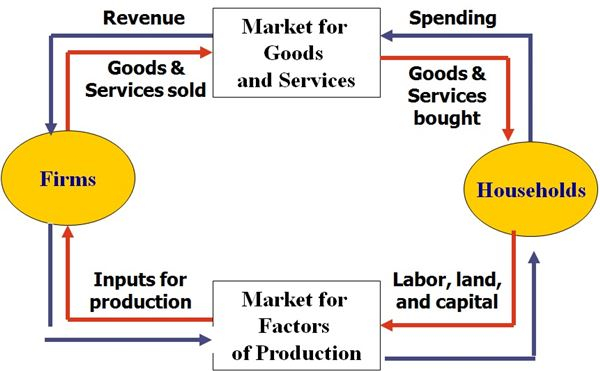
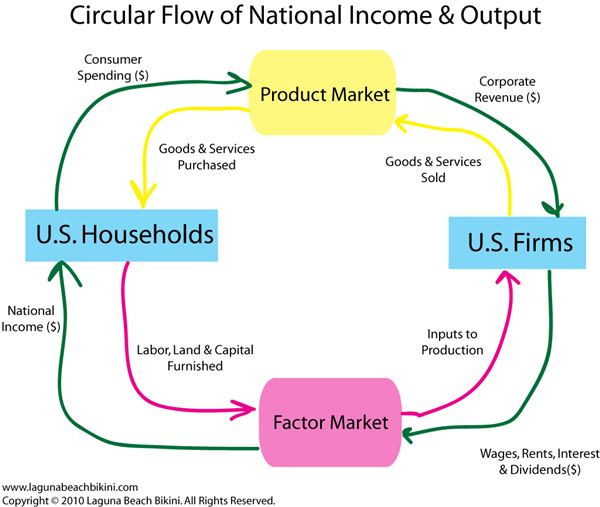
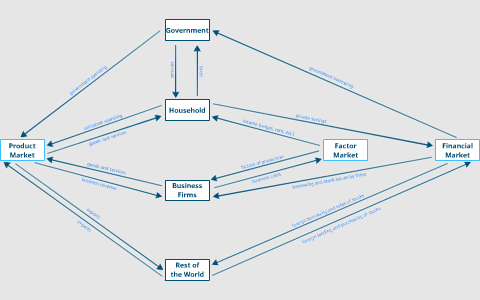
An economic circular flow chart is a visual representation of the flow of money, goods, and services in an economy. It illustrates how households, businesses, and the government interact and exchange resources. The circular flow chart typically consists of two main sectors: the household sector and the business sector.
The household sector represents individuals and families who consume goods and services produced by businesses. On the other hand, the business sector includes all the firms and companies that produce and sell goods and services to households. Additionally, the government sector may also be included in the circular flow chart to show the role of government in the economy.
Economic Circular Flow Chart
Key Components of an Economic Circular Flow Chart
The economic circular flow chart consists of several key components that illustrate the flow of money and resources in an economy. These components include:
1. Households: Represented by individuals or families who own and consume goods and services produced by businesses.
2. Businesses: Includes all the firms and companies that produce and sell goods and services to households.
3. Goods and Services: Represent the physical products and services exchanged between households and businesses.
4. Factor Payments: Refers to the income earned by households in exchange for their resources, such as labor and capital, which are used by businesses to produce goods and services.
5. Government: Represents the role of the government in the economy, including taxation, spending, and regulation.
Importance of Understanding the Economic Circular Flow Chart
Understanding the economic circular flow chart is crucial for policymakers, economists, and individuals alike. By visualizing the flow of money, goods, and services in an economy, stakeholders can better comprehend the interconnectedness of different sectors and the impact of economic policies.
Moreover, analyzing the economic circular flow chart can help identify potential bottlenecks or inefficiencies in the economy and inform decision-making processes. By studying the flow of resources and money, stakeholders can make informed choices to promote economic growth, stability, and prosperity for all members of society.
By creating and analyzing an economic circular flow chart, stakeholders can gain valuable insights into the functioning of an economy and make informed decisions to promote economic growth and stability.
Download Economic Circular Flow Chart
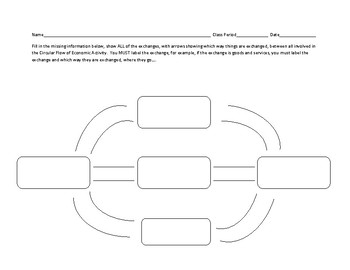
Blank Circular Flow Chart
Economic Circular Flow Diagram
Economic Circular Flow Diagram
Economic Circular Flow Chart Template By Michael Bennett On Prezi
