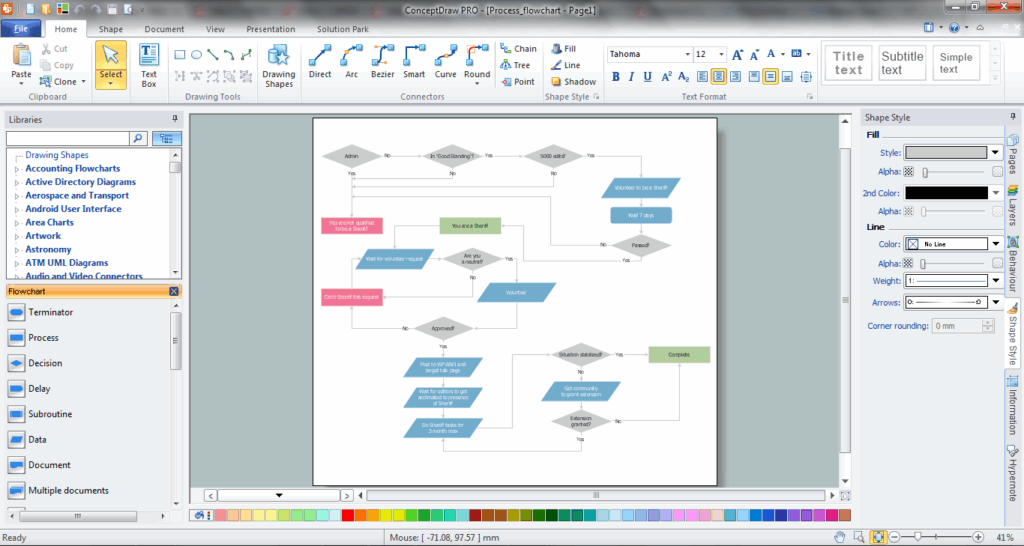
Process flow charts are essential tools for visualizing the steps involved in a process. They provide a clear and concise overview of how a process works, making it easier for teams to understand and follow the steps required to complete a task efficiently. By using a process flow chart, organizations can identify bottlenecks, streamline workflows, and improve overall productivity.
Example Of Process Flow Chart
Components of a Process Flow Chart
A typical process flow chart consists of various elements, including:
1. Start and End Points: These indicate where the process begins and ends.
2. Process Steps: These are the individual tasks or activities that make up the process.
3. Decision Points: These are points where a decision needs to be made, leading to different paths in the process.
4. Connectors: These show the flow of the process from one step to another.
5. Annotations: These provide additional information or explanations about specific steps in the process.
Example of a Process Flow Chart
Let’s consider an example of a process flow chart for a customer service request:
1. Start: Customer submits a request.
2. Process Step: Customer service representative receives the request.
3. Decision Point: Is the issue resolved?
– Yes: End.
– No: Escalate to supervisor.
4. Process Step: Supervisor investigates the issue.
5. Decision Point: Is the issue resolved?
– Yes: End.
– No: Escalate to management.
6. End: Issue resolved.
