Flow charts are a visual representation of a process or workflow. They are commonly used in business, engineering, and other fields to illustrate the steps involved in completing a task. Excel, with its powerful tools and functions, is a great platform for creating flow charts. To create a flow chart in Excel, you can use various symbols to represent different elements of the process.
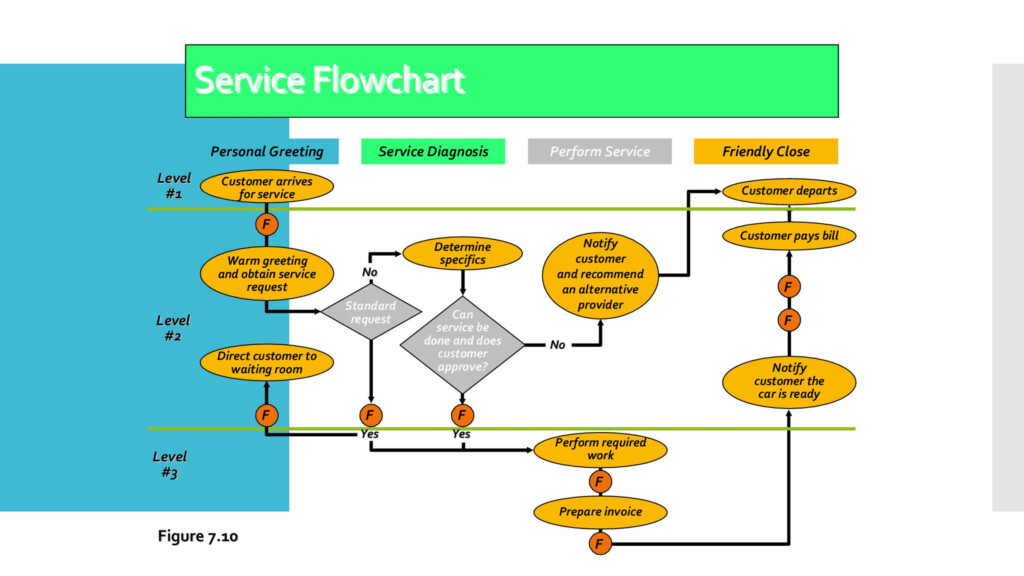
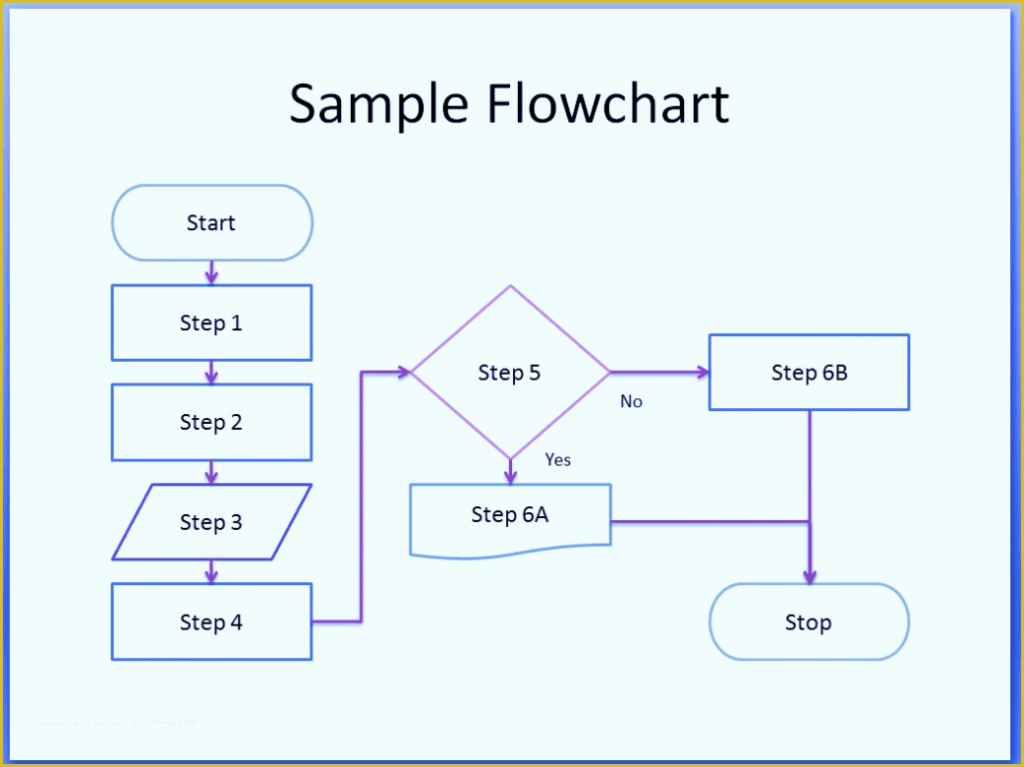
There are several standard flow chart symbols that are commonly used in Excel. These symbols include rectangles for processes, diamonds for decisions, ovals for start/end points, and arrows to show the flow of the process. By using these symbols effectively, you can create clear and easy-to-understand flow charts in Excel.
Excel Flow Chart Symbols
Common Excel Flow Chart Symbols
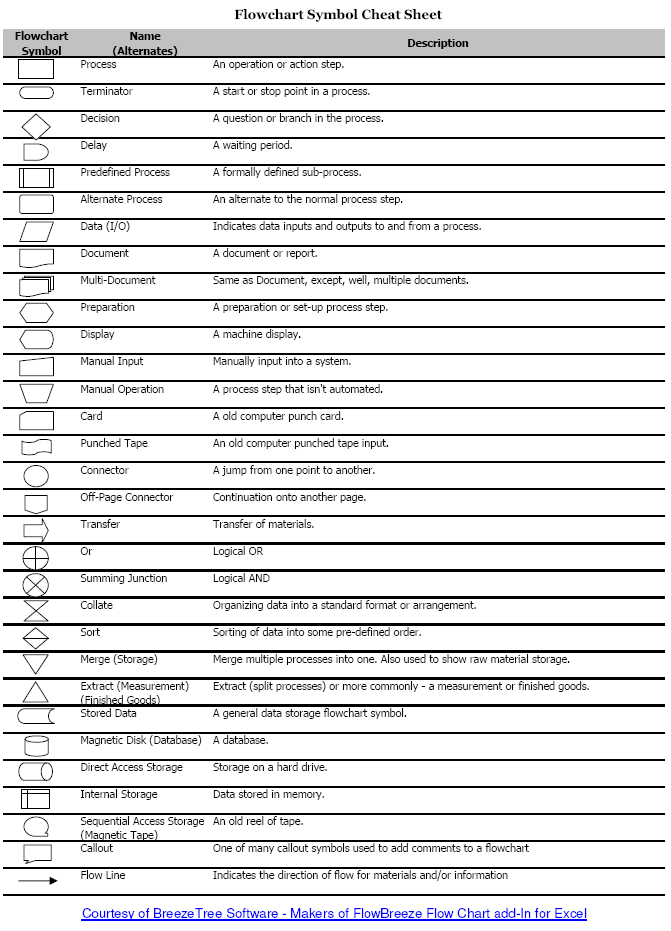
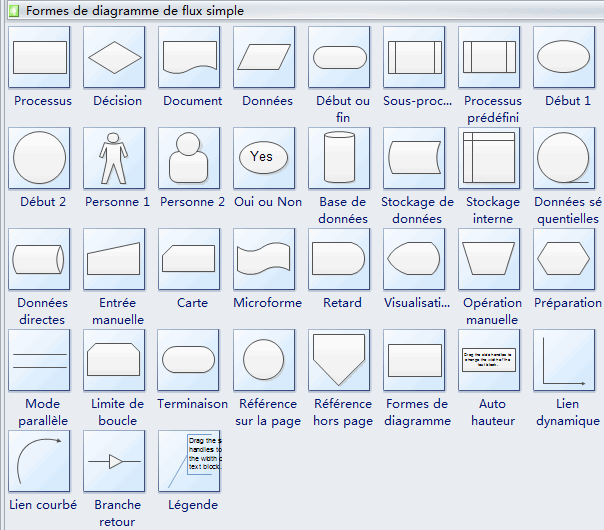
One of the most commonly used symbols in Excel flow charts is the rectangle, which represents a process or task. The diamond symbol is used to represent a decision point, where the flow of the process can go in different directions. The oval symbol is used for start and end points of the process. Arrows are used to connect the symbols and show the flow of the process.
Other common symbols used in Excel flow charts include the parallelogram, which represents input or output, and the circle, which represents a connector point. By using these symbols in combination, you can create a detailed and comprehensive flow chart in Excel that effectively communicates the steps of a process.
Creating Flow Charts in Excel
To create a flow chart in Excel, start by selecting the symbols you want to use from the Insert Shapes menu. Drag and drop the symbols onto your Excel worksheet and connect them using arrows to show the flow of the process. You can customize the appearance of the symbols, such as color and size, to make your flow chart more visually appealing.
Once you have created your flow chart in Excel, you can easily update and modify it as needed. By using Excel flow chart symbols effectively, you can create professional-looking flow charts that help you visualize and analyze your processes more effectively.
By following these guidelines and using the appropriate Excel flow chart symbols, you can create informative and visually appealing flow charts in Excel that effectively communicate the steps of a process. Whether you are illustrating a business process, project workflow, or decision-making flow, Excel flow charts can help you streamline your processes and improve your productivity.
Download Excel Flow Chart Symbols
Flow Chart Symbols Cheat Sheet BreezeTree
Excel Flow Chart Symbols
Excel Flow Chart Symbols
Excel Flow Chart Symbols
