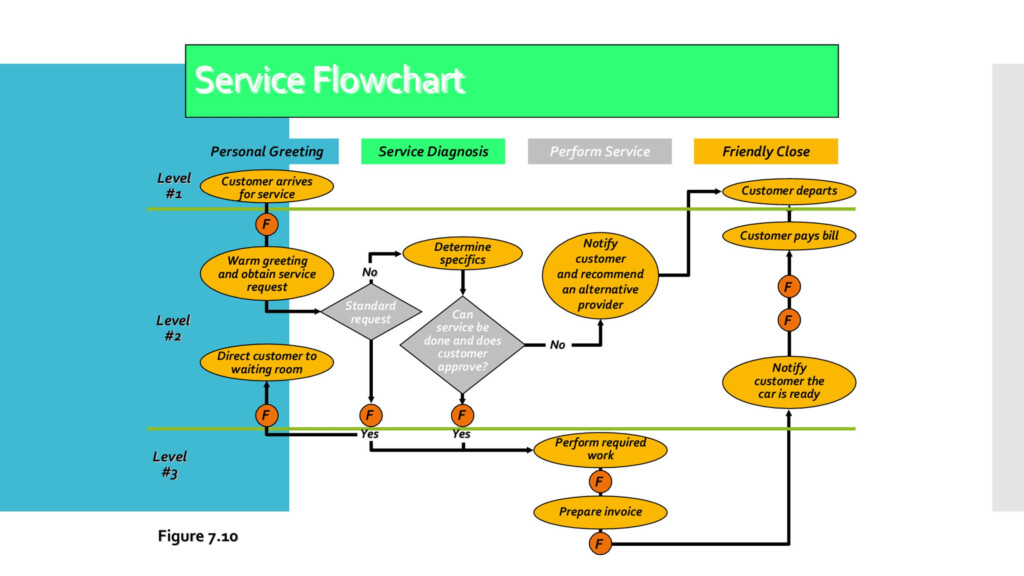
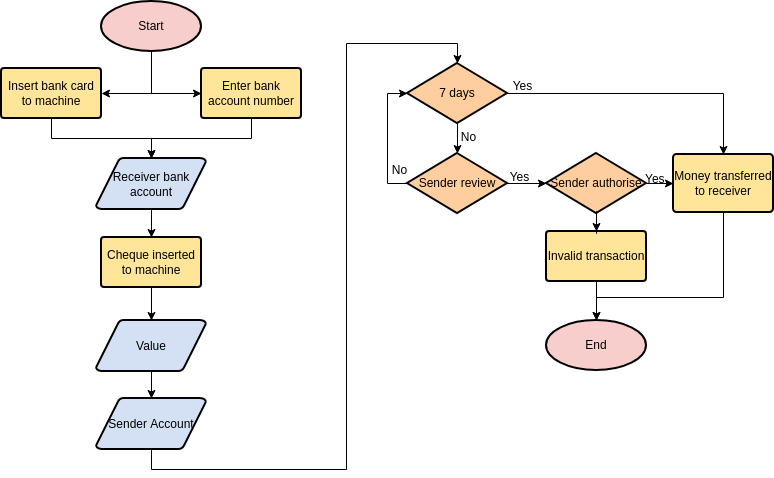
Inserting a flow chart in Excel can be a useful way to visually represent a process or workflow. Flow charts can help organize information, identify bottlenecks, and improve understanding of complex systems. In Excel, you can easily create flow charts using shapes, connectors, and text boxes.
To insert a flow chart in Excel, you can use the built-in shapes and connectors available in the program. This allows you to create a customized flow chart that fits your specific needs. In this article, we will explore how to insert a flow chart in Excel and provide tips for creating an effective and visually appealing chart.
Excel Insert Flow Chart
How to Insert a Flow Chart in Excel
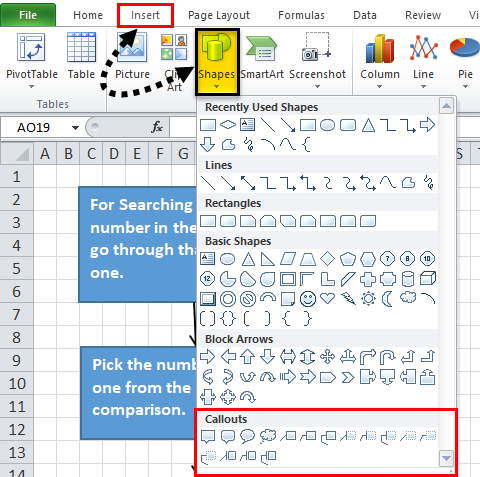
To insert a flow chart in Excel, first, open a new or existing worksheet where you want to create the flow chart. Then, navigate to the “Insert” tab in the Excel ribbon and click on the “Shapes” dropdown menu. From the shapes menu, select the shape you want to use as the starting point of your flow chart, such as a rectangle for a process step.
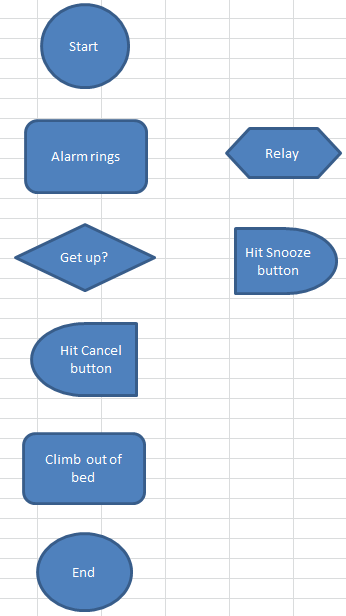
Next, click and drag the selected shape onto the worksheet to create the first step in your flow chart. You can then add additional shapes, connectors, and text boxes to create the rest of the flow chart. Use connectors to link the shapes together and show the flow of the process. You can also customize the appearance of the shapes and connectors by changing their colors, sizes, and styles.
Tips for Creating an Effective Flow Chart
When creating a flow chart in Excel, it’s important to keep the following tips in mind to ensure that your chart is clear, easy to understand, and visually appealing:
1. Use consistent shapes and colors to represent different types of steps or processes.
2. Label each shape or connector with a brief description to explain its purpose.
3. Use connectors to show the direction of the flow and clearly indicate the sequence of steps.
4. Keep the flow chart simple and avoid overcrowding it with unnecessary details.
5. Review and test your flow chart to ensure that it accurately represents the process or workflow you are trying to illustrate.
By following these tips and using the built-in tools in Excel, you can create professional-looking flow charts that effectively communicate complex processes and workflows. Inserting a flow chart in Excel can help you visualize and analyze information in a clear and organized manner, making it a valuable tool for business, education, and project management.
With these simple steps and tips, you can easily insert a flow chart in Excel and create visually appealing charts that effectively communicate information and data.
Download Excel Insert Flow Chart
Excel Flow Chart Templates NBKomputer
Insert Flow Chart Excel Ponasa
Insert Flow Chart Excel Ponasa
How To Insert Process Flow Chart In Excel Riset
