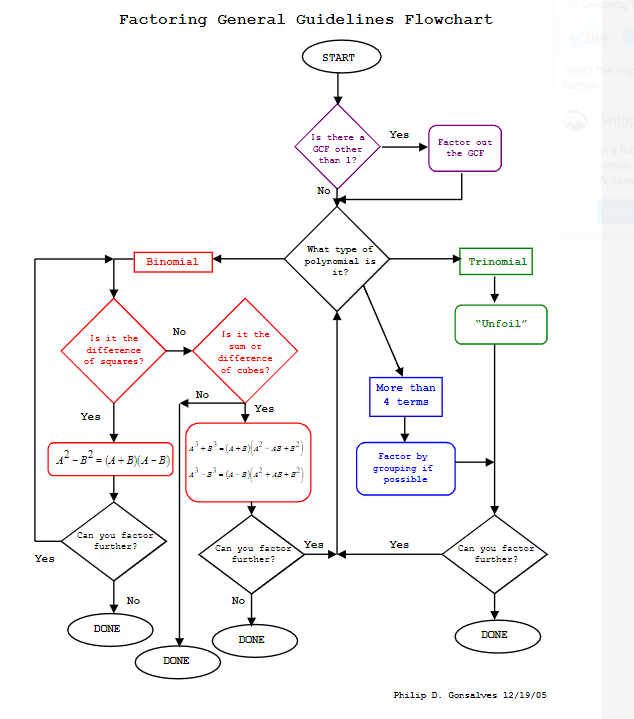
A flow chart is a visual representation of a process or algorithm. In math, flow charts are commonly used to illustrate the steps involved in solving a problem or performing a calculation. Each step in the process is represented by a shape, such as a rectangle or diamond, with arrows connecting the shapes to show the flow of the process.
Flow charts are a helpful tool for organizing complex problems and breaking them down into smaller, more manageable steps. They can also help students understand the logic behind mathematical procedures and see how different steps are connected to each other.
Flow Chart In Math
How to Create a Flow Chart in Math
Creating a flow chart in math is a straightforward process that involves identifying the steps needed to solve a problem and connecting them in a logical sequence. Here are some tips for creating an effective flow chart:
- Start by defining the problem or calculation you need to solve.
- Break down the problem into smaller steps, each represented by a shape in the flow chart.
- Connect the shapes with arrows to show the flow of the process.
- Label each shape with a brief description of the step it represents.
- Test your flow chart by following the steps to ensure they lead to the correct solution.
By following these steps, you can create a clear and easy-to-follow flow chart that will help you solve math problems more efficiently.
