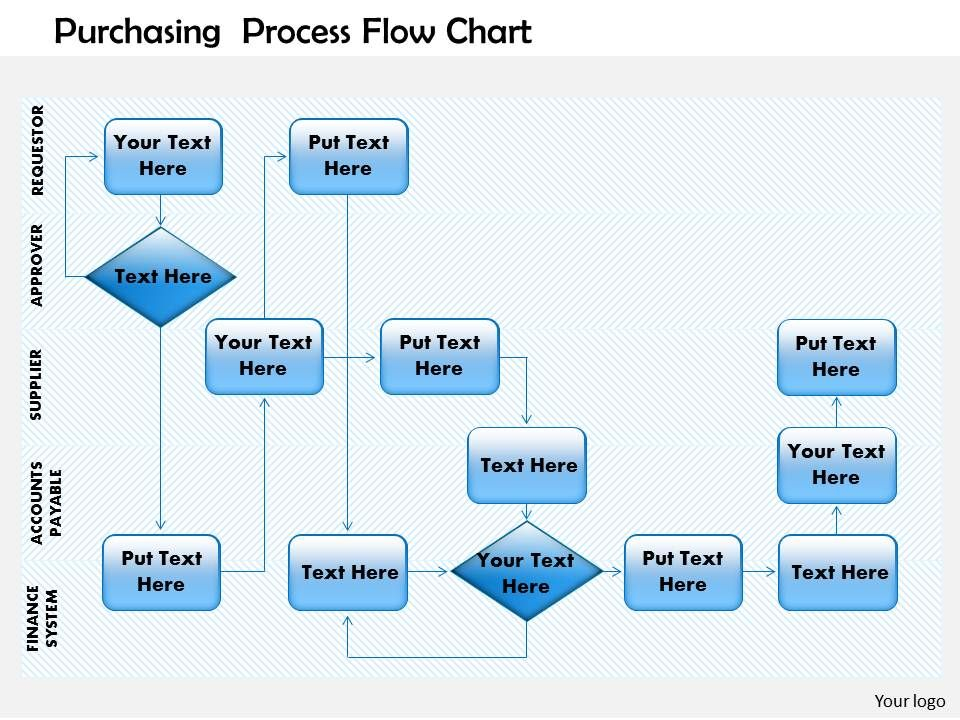
Flow charts are an essential tool for visualizing processes and information in a clear and organized manner. When used in PowerPoint presentations, flow charts can help simplify complex concepts, improve audience understanding, and enhance overall presentation effectiveness. By breaking down information into easy-to-follow steps or sequences, flow charts can guide viewers through a topic or process, making it easier for them to grasp key points and connections.
Creating flow charts in PowerPoint is a straightforward process that can be done using built-in shapes and tools. By incorporating flow charts into your presentations, you can add visual interest and structure to your content, making it more engaging and memorable for your audience. Whether you’re explaining a workflow, outlining a decision-making process, or illustrating a hierarchy, flow charts can help you communicate your ideas effectively and efficiently.
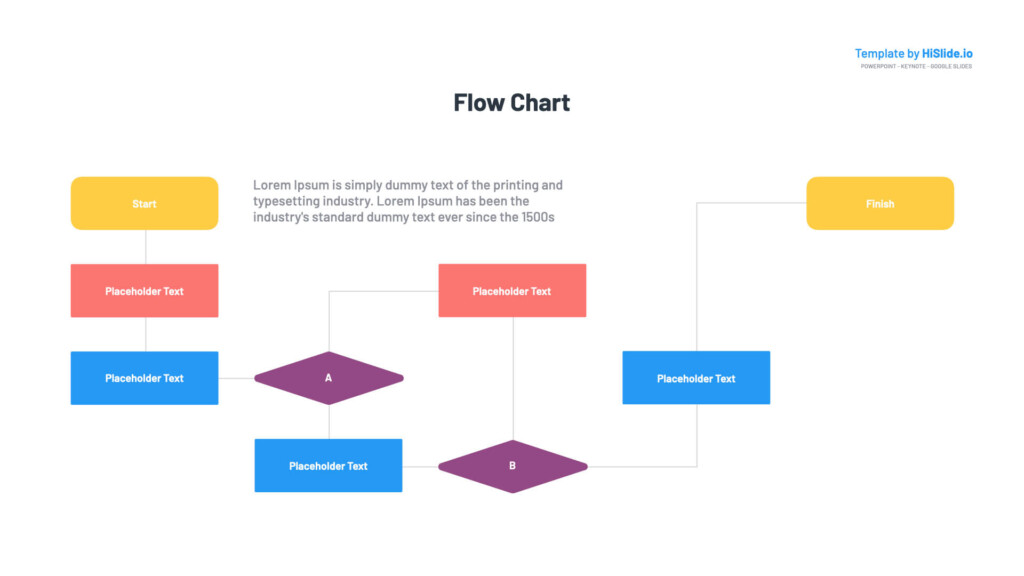
Flow Chart In Powerpoint Presentation
How to Create a Flow Chart in PowerPoint
To create a flow chart in PowerPoint, start by selecting the Insert tab and choosing the Shapes option. From the Shapes menu, select the type of shape you want to use for your flow chart, such as a rectangle for a process step or a diamond for a decision point. Drag and drop the shape onto your slide, then use the sizing handles to adjust its size and position.
Connect your shapes by selecting the Line tool from the Shapes menu and drawing lines between them. You can add text to your shapes by double-clicking inside them and typing your content. Customize the appearance of your flow chart by changing the colors, fonts, and styles of your shapes and lines. Once you’ve added all your shapes and connected them, your flow chart is ready to be presented to your audience.
Tips for Using Flow Charts Effectively in PowerPoint Presentations
When using flow charts in PowerPoint presentations, keep these tips in mind to ensure their effectiveness:
1. Keep it simple: Use clear, concise language and minimal text to make your flow chart easy to understand at a glance.
2. Use consistent formatting: Maintain a uniform style and color scheme throughout your flow chart to create a cohesive visual design.
3. Use arrows to indicate flow: Use arrows to show the direction of the process flow and guide viewers through the steps in your chart.
4. Test your flow chart: Before presenting your flow chart, review it for accuracy and clarity to ensure that it effectively conveys your message to your audience.
By following these tips and incorporating flow charts into your PowerPoint presentations, you can enhance the clarity and impact of your content, making it easier for your audience to follow along and engage with your message.
Download Flow Chart In Powerpoint Presentation
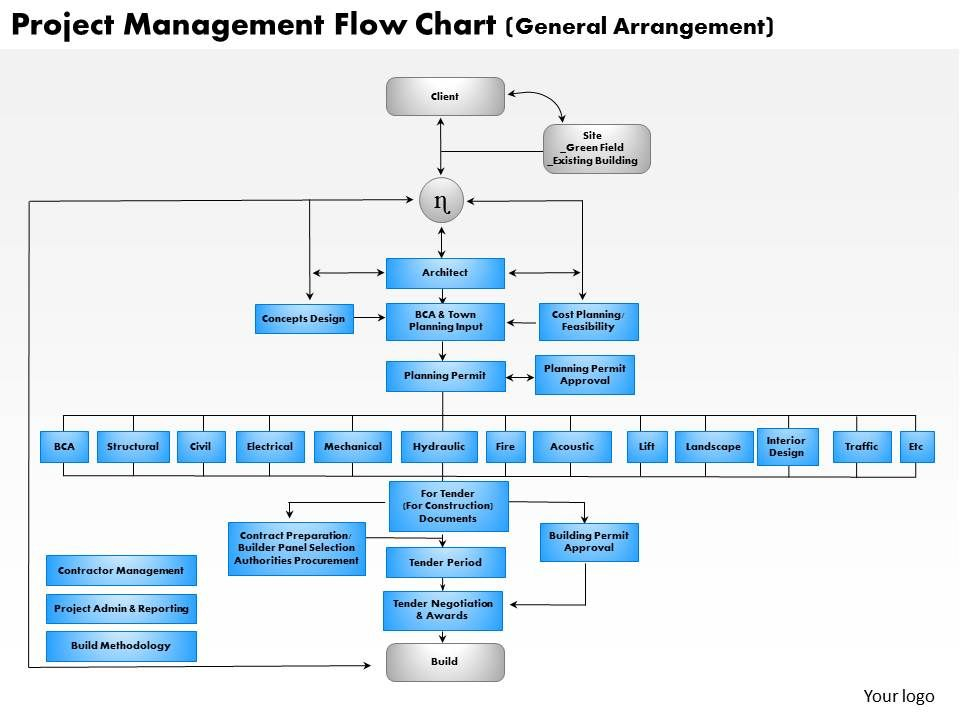
0514 Project Management Flow Chart Powerpoint Presentation PowerPoint
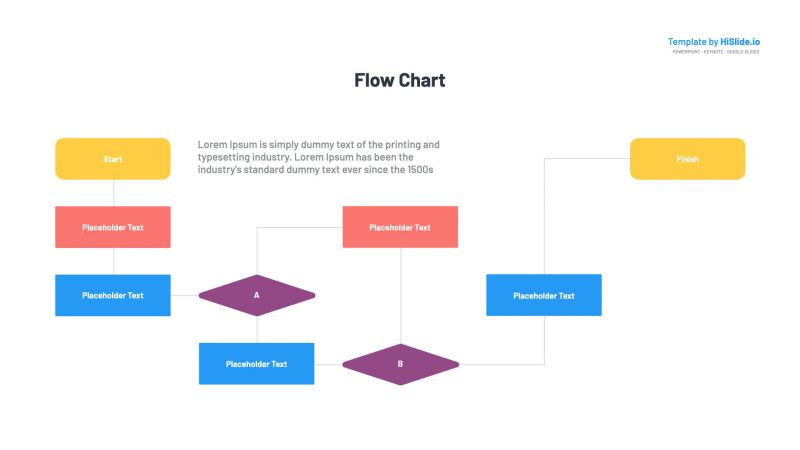
Flow Chart PowerPoint Presentation
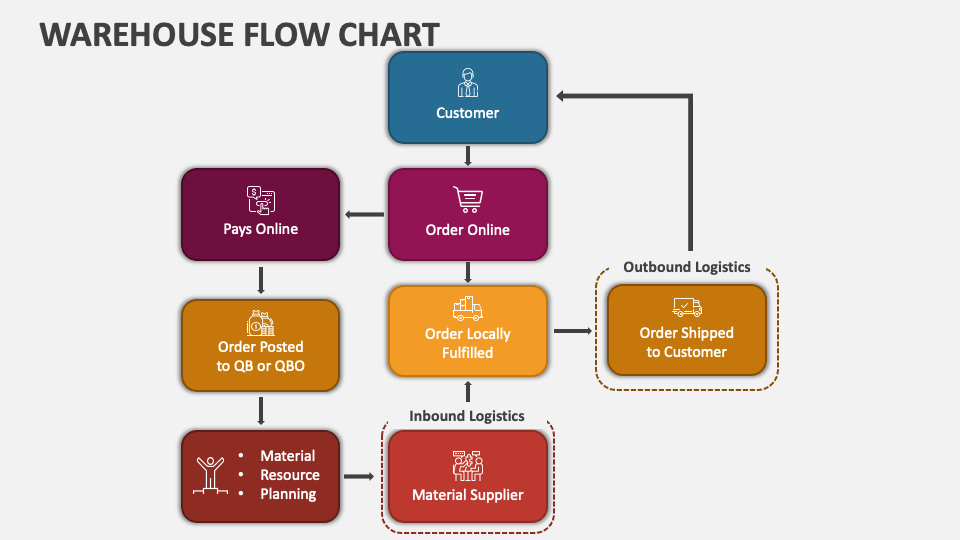
Warehouse Flow Chart PowerPoint Presentation Slides PPT Template
0514 Purchasing Process Flow Chart Powerpoint Presentation PPT Images
