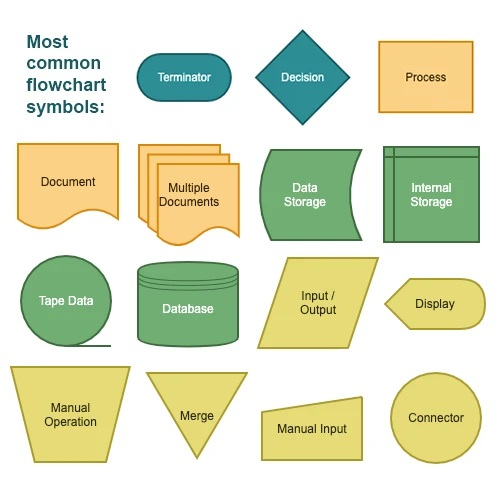
When creating a flow chart, it is essential to follow certain shape conventions to ensure clarity and consistency. The basic flow chart shapes include rectangles for processes, diamonds for decisions, and arrows for connecting the shapes. Rectangles represent actions or steps in the process, diamonds denote decision points where the flow can branch out, and arrows show the direction of the flow.
By adhering to these conventions, you can easily convey the flow of a process or system in a visually appealing and understandable manner. Consistency in shape usage also helps viewers quickly grasp the information presented in the flow chart.
Flow Chart Shape Conventions
Additional Shapes
In addition to the basic shapes, there are other flow chart symbols that can be used to represent specific actions or events. For example, ovals are commonly used to indicate the start and end points of a process. Rounded rectangles can be used for input/output operations, while parallelograms can represent data or documents.
Using these additional shapes can help provide more detailed information in your flow chart and make it easier for viewers to interpret the various elements of the process or system being depicted. It is important to use these shapes consistently and in accordance with established conventions to maintain clarity and understanding.
Best Practices
When creating flow charts, it is important to keep the following best practices in mind:
- Use clear and concise labels for each shape to indicate the action or decision it represents.
- Ensure that the flow of the chart is logical and easy to follow from start to finish.
- Avoid overcrowding the chart with too many shapes or arrows, as this can make it difficult to read and understand.
- Use color coding or shading to group related shapes or highlight important information.
By following these best practices and adhering to flow chart shape conventions, you can create effective and informative flow charts that effectively communicate processes and systems to your audience.
