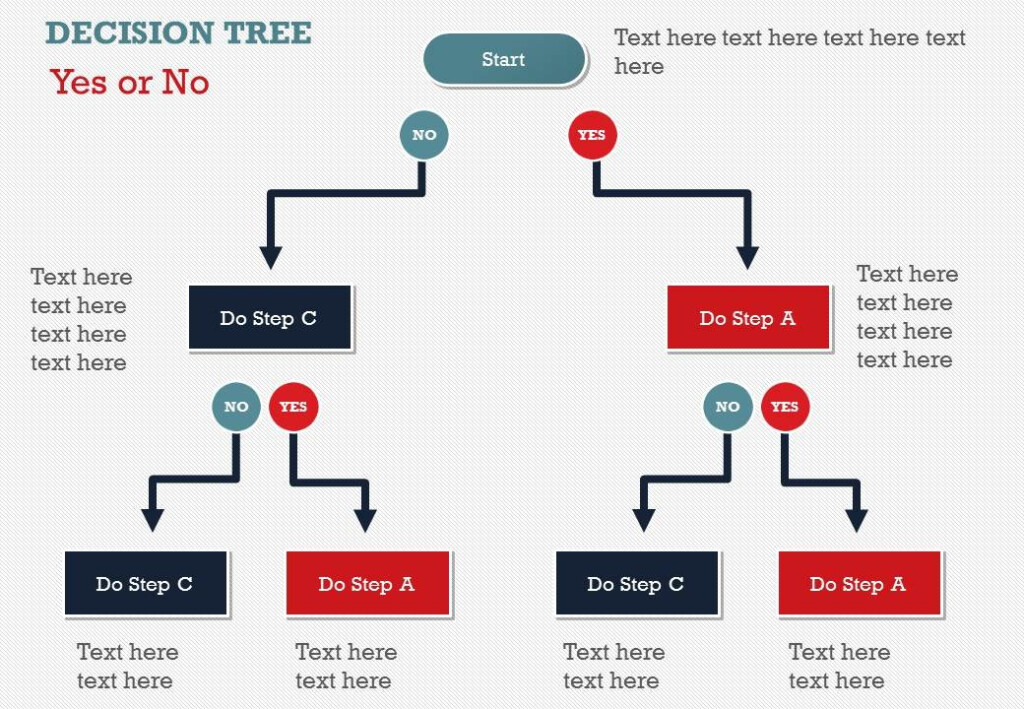
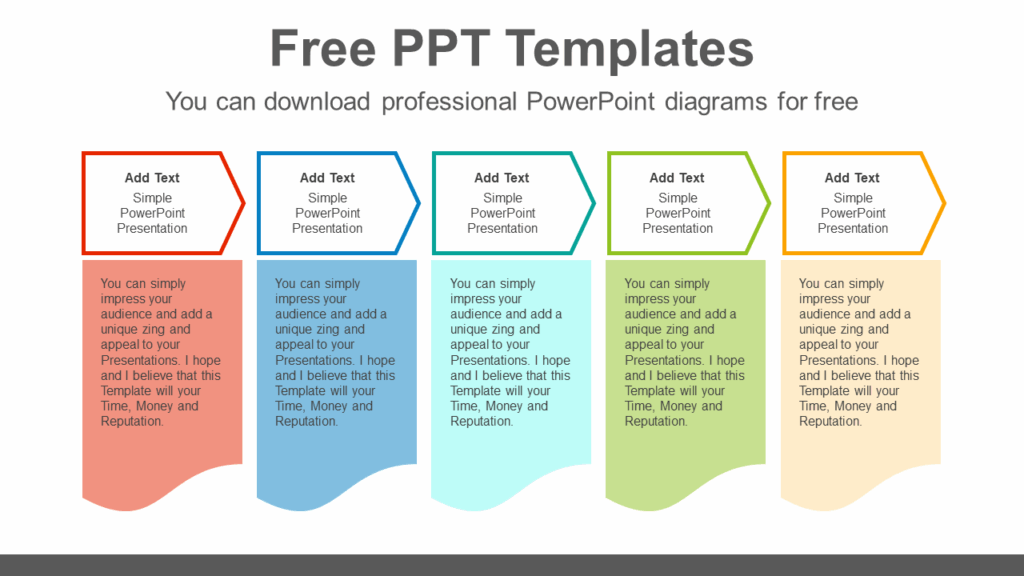
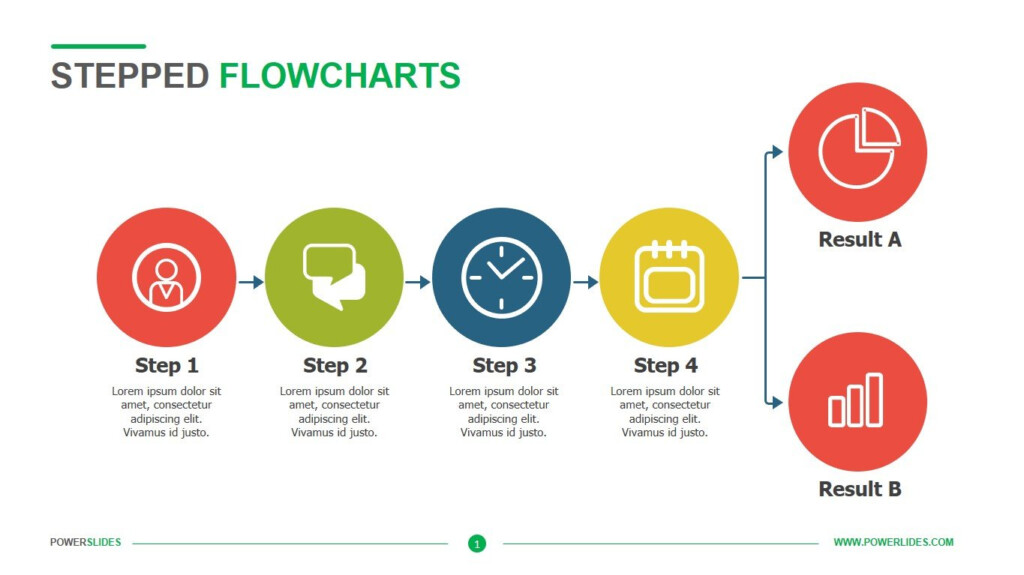
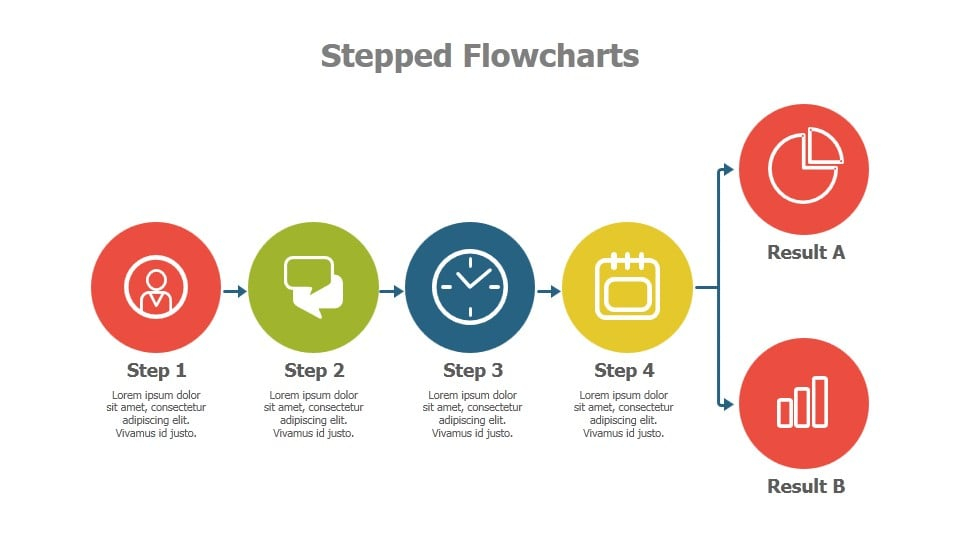
Flow charts for PowerPoint are visual representations that illustrate the steps or processes in a workflow. They are commonly used in business presentations, project management, and decision-making processes to help clarify complex information and make it easier to understand. Flow charts typically consist of shapes, arrows, and text labels that show the sequence of actions or steps in a process.
PowerPoint is a popular tool for creating flow charts because it allows users to easily add shapes, connect them with lines, and customize the appearance of the chart to suit their needs. With the right design and layout, flow charts in PowerPoint can effectively communicate complex ideas and help audiences grasp key concepts quickly.
Flow Charts For Powerpoint
How To Create Flow Charts For PowerPoint
1. Start by opening PowerPoint and selecting a blank slide to work on.
2. Go to the Insert tab and click on Shapes to choose the shapes you want to use in your flow chart, such as rectangles for process steps, diamonds for decision points, and arrows to connect the shapes.
3. Drag and drop the shapes onto the slide and arrange them in the sequence of the process you want to illustrate.
4. Use text boxes to add labels and descriptions to each shape to provide more context and clarity.
5. Connect the shapes with lines or arrows to show the flow of the process.
6. Customize the appearance of the flow chart by changing the colors, fonts, and styles to make it visually appealing.
7. Add any additional elements, such as icons or images, to further enhance the visual representation of the flow chart.
8. Review and edit the flow chart as needed to ensure it effectively conveys the information you want to communicate.
Benefits Of Using Flow Charts In PowerPoint
Flow charts in PowerPoint offer several benefits, including:
1. Clarity: Flow charts help break down complex processes into simple, easy-to-follow steps, making it easier for audiences to understand the information being presented.
2. Visual Appeal: By using shapes, colors, and icons, flow charts in PowerPoint can grab the audience’s attention and make the information more engaging and memorable.
3. Organization: Flow charts help organize information in a logical sequence, making it easier to see the connections between different steps in a process.
4. Decision-making: Flow charts can be used to analyze different options, identify potential bottlenecks, and make informed decisions based on the visual representation of the data.
Overall, flow charts for PowerPoint are a powerful tool for presenting complex information in a clear and visually appealing way, making them an essential asset for business professionals, educators, and presenters looking to communicate ideas effectively.
Download Flow Charts For Powerpoint
Ultimate Tips To Make Attractive Flow Charts In PowerPoint
Free Flow Charts For Powerpoint Download Our 100 Free Flow Chart Bilarasa
Linear Flow Chart Powerslides
PowerPoint FlowChart Templates


