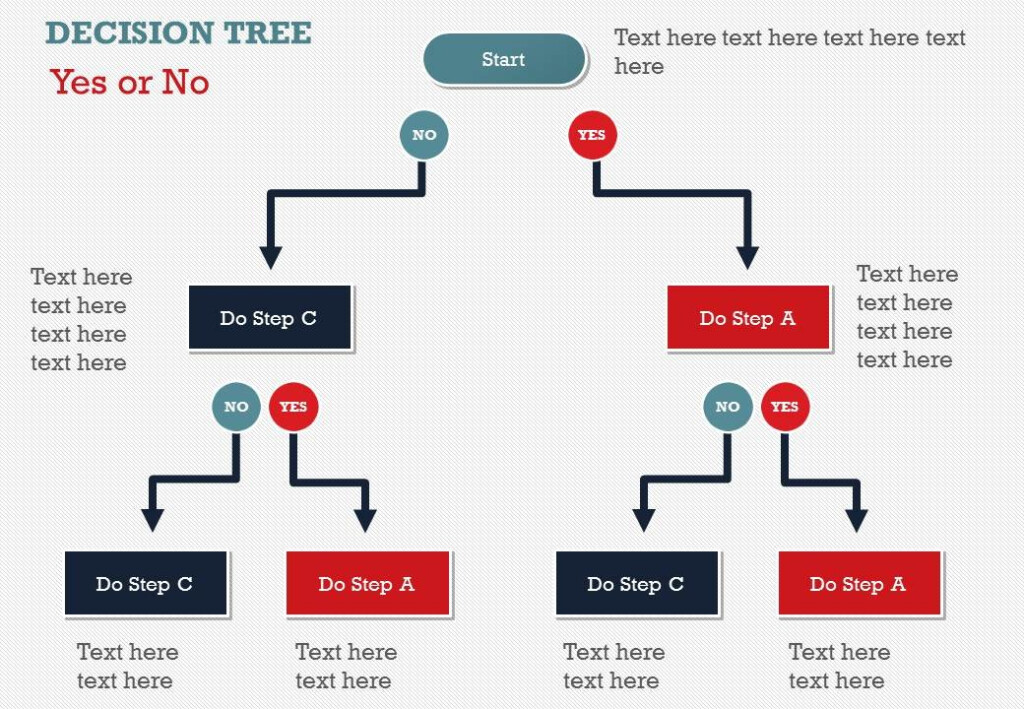
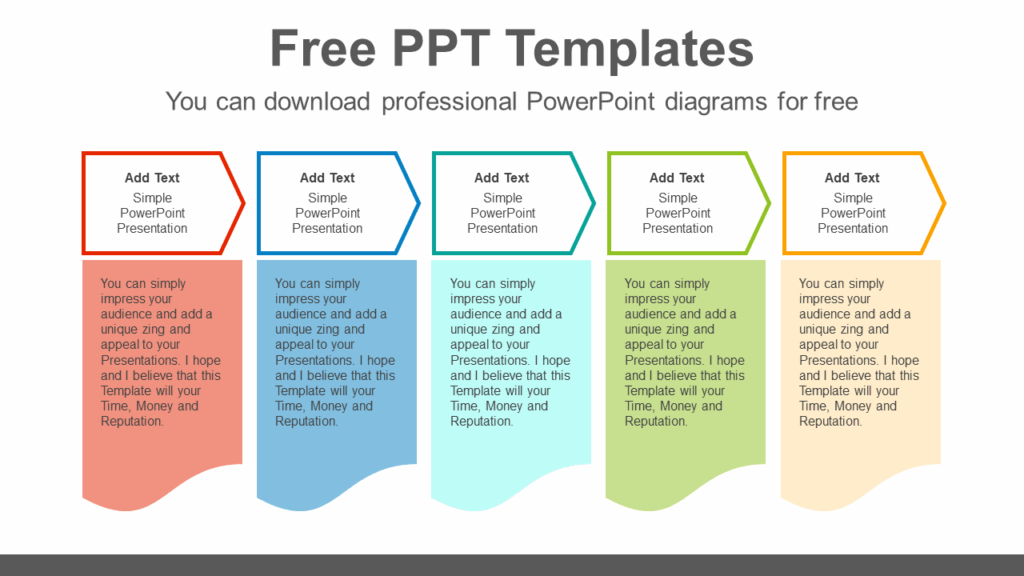
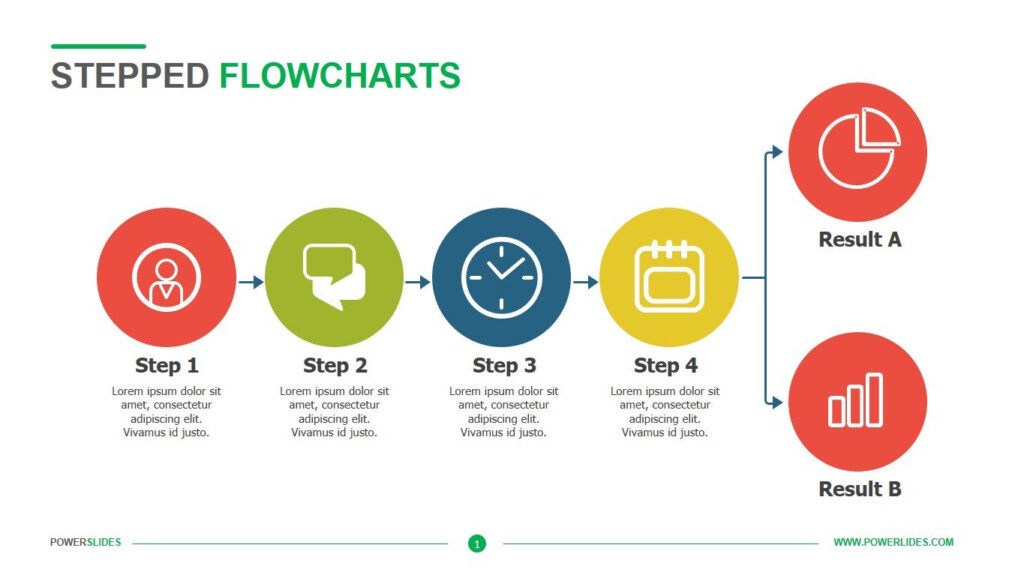
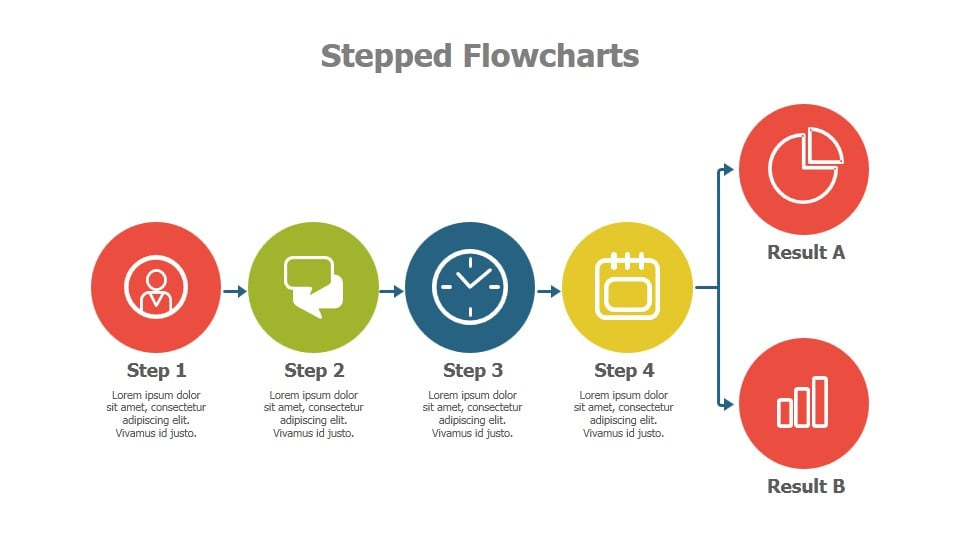
Flow charts are a great way to visually represent processes, workflows, and decision-making steps. PowerPoint is a versatile tool that can be used to create professional-looking flow charts quickly and easily. Follow these steps to create flow charts in PowerPoint:
Open PowerPoint and start with a blank slide. Go to the “Insert” tab and click on “Shapes.” Choose the shape you want to use for your flow chart, such as a rectangle for a process step or a diamond for a decision point. Click and drag to draw the shape on the slide.
Flow Charts In Powerpoint
2. Add Text and Connect Shapes
Double-click on the shape to add text and describe the step or decision. To connect shapes, go to the “Insert” tab, click on “Shapes,” and select a connector line. Click and drag to connect the shapes and create the flow of your chart.
3. Customize Your Flow Chart
Use PowerPoint’s formatting tools to customize your flow chart. Change the colors, fonts, and sizes of the shapes and text to make your flow chart visually appealing and easy to understand. You can also add icons, images, or arrows to enhance the design.
4. Present and Share Your Flow Chart
Once you have created your flow chart, you can present it directly from PowerPoint or save it as a PDF or image file to share with others. PowerPoint also offers collaboration features, so you can work on flow charts with your team in real-time.
Benefits of Using Flow Charts in PowerPoint
There are several benefits to using flow charts in PowerPoint for presenting information and processes:
1. Visual Communication
Flow charts are a visual representation of complex processes, making it easier for audiences to understand the flow of information or decision-making steps. PowerPoint allows you to create visually appealing flow charts that engage your audience and convey information effectively.
2. Easy to Edit and Update
PowerPoint’s user-friendly interface makes it easy to edit and update flow charts as needed. You can quickly rearrange shapes, add or remove steps, or change colors and formatting without starting from scratch. This flexibility ensures that your flow charts are always up-to-date and accurate.
3. Professional Presentation
Flow charts created in PowerPoint have a polished and professional look, making them suitable for presentations in business meetings, conferences, or training sessions. With PowerPoint’s design tools, you can create flow charts that align with your company’s branding and style guidelines.
Overall, flow charts in PowerPoint are a valuable tool for visually representing processes and workflows in a clear and engaging way. By following these steps and utilizing PowerPoint’s features, you can create flow charts that effectively communicate information and help your audience understand complex concepts.
Download Flow Charts In Powerpoint
Ultimate Tips To Make Attractive Flow Charts In PowerPoint
Free Flow Charts For Powerpoint Download Our 100 Free Flow Chart Bilarasa
Linear Flow Chart Powerslides
PowerPoint FlowChart Templates


