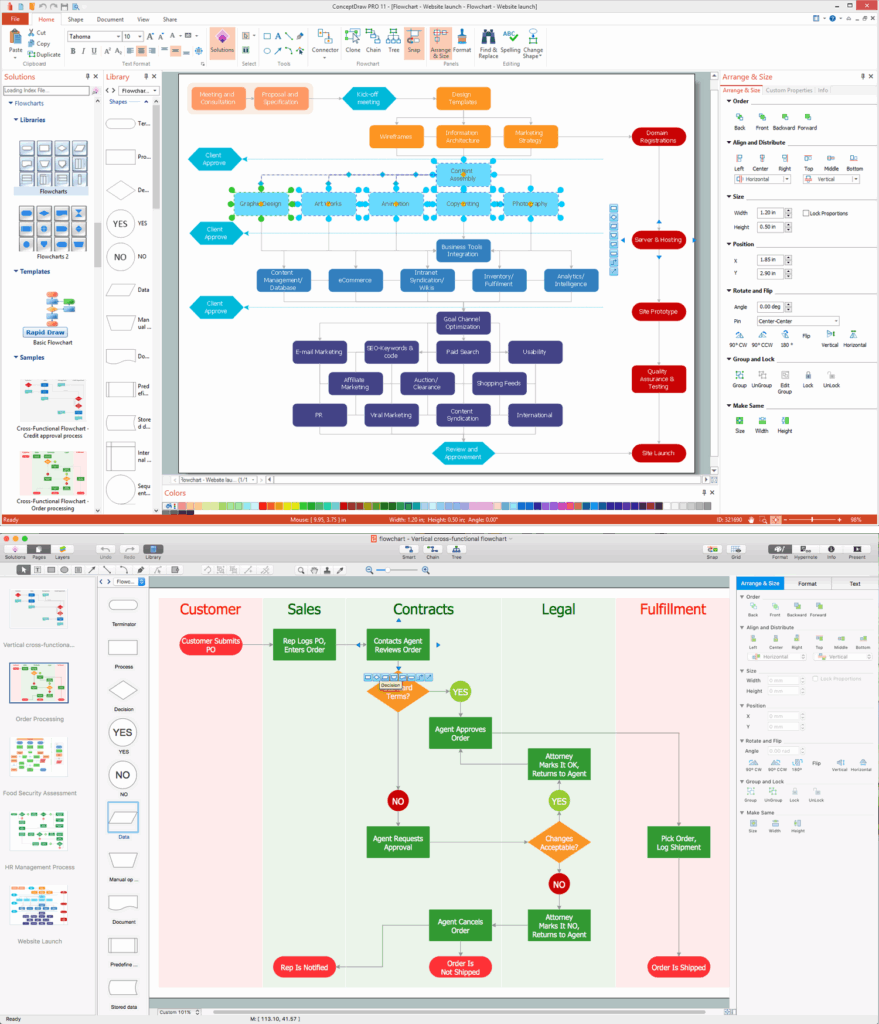
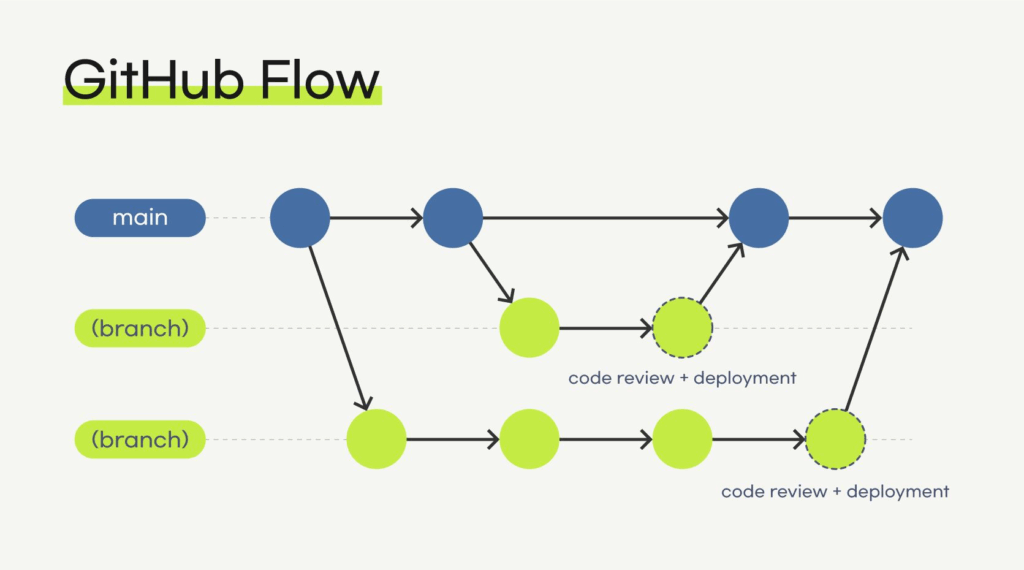
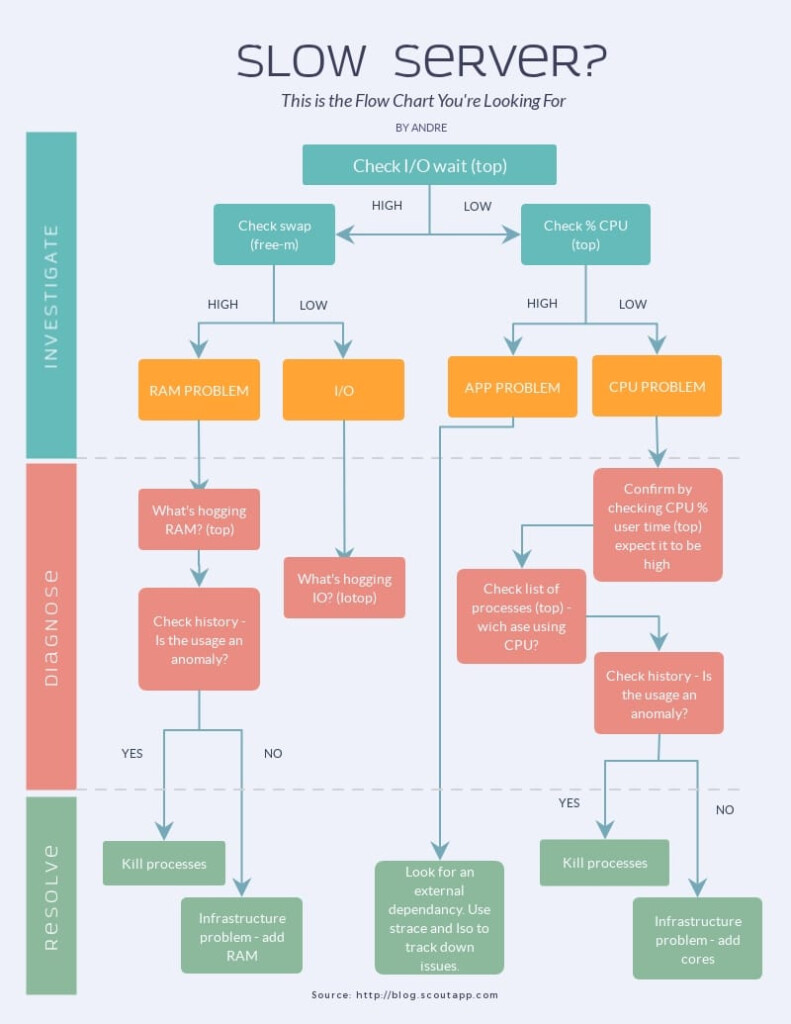
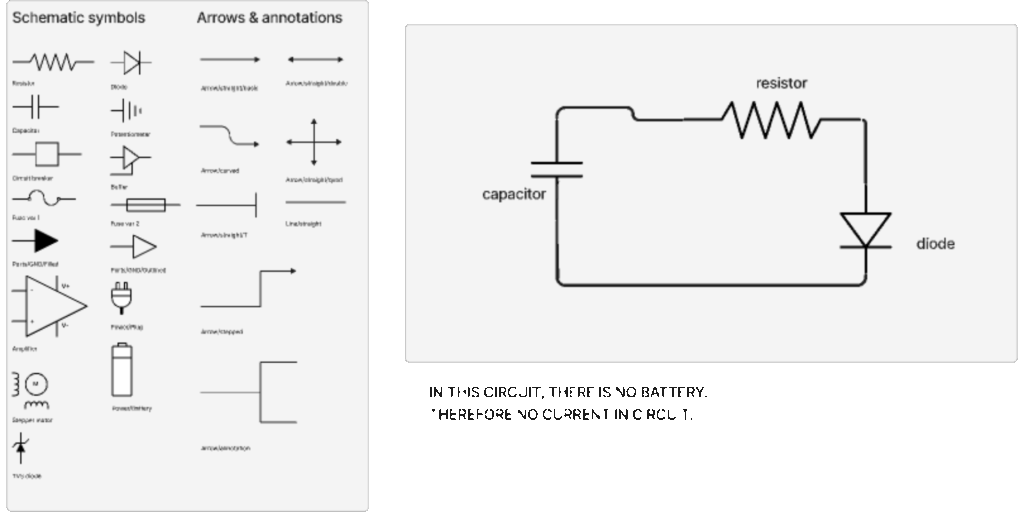
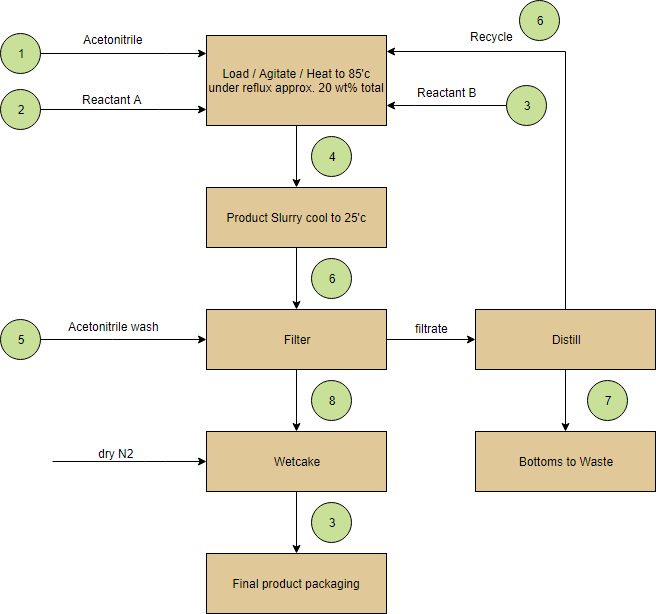
A flow diagram is a visual representation of a process or system that shows the sequence of steps or actions. It uses symbols and arrows to show the flow of information or materials from one step to another. Flow diagrams are commonly used in various industries such as engineering, software development, and project management to illustrate complex processes in a simple and easy-to-understand way.
Flow diagrams can help identify bottlenecks, inefficiencies, and opportunities for improvement in a process. They can also be used to communicate ideas, analyze workflows, and guide decision-making. By breaking down a process into smaller steps and visualizing the connections between them, flow diagrams can help streamline operations and increase productivity.
Flow Diagram And Flow Chart
What is a Flow Chart?
A flow chart is a type of flow diagram that uses different shapes and lines to represent the steps in a process or system. Each shape in a flow chart represents a specific action or decision, and arrows connecting the shapes show the flow of information or materials between them. Flow charts are widely used in various fields to map out processes, workflows, algorithms, and decision trees.
Flow charts can be simple or complex, depending on the complexity of the process being represented. They are commonly used in project management, software development, quality control, and business process improvement. Flow charts can help visualize the sequence of steps in a process, identify potential problems or bottlenecks, and streamline operations for increased efficiency.
Key Differences Between Flow Diagrams and Flow Charts
While flow diagrams and flow charts are both visual tools used to represent processes, there are some key differences between the two. Flow diagrams tend to be more general and high-level, focusing on the overall flow of information or materials in a process. Flow charts, on the other hand, are more detailed and specific, breaking down the process into individual steps and decision points.
Flow diagrams are often used to provide an overview of a process, while flow charts are used to show the detailed sequence of steps within that process. Flow diagrams are more abstract and conceptual, while flow charts are more concrete and procedural. Both tools are valuable for analyzing and improving processes, but they serve slightly different purposes and audiences.
By understanding the differences between flow diagrams and flow charts, you can choose the right tool for your specific needs and effectively communicate complex processes. Whether you’re a project manager, engineer, or software developer, incorporating flow diagrams and flow charts into your workflow can help streamline operations, improve efficiency, and drive better decision-making.
Download Flow Diagram And Flow Chart
Gitflow Diagram Git Flow Git Flow Vrogue co
DIAGRAM Process Flow Diagram Format MYDIAGRAM ONLINE
Schematic Diagram WITH Flow Chart And It 39 s Meaning Figma Community
Block Diagram Flow Chart
