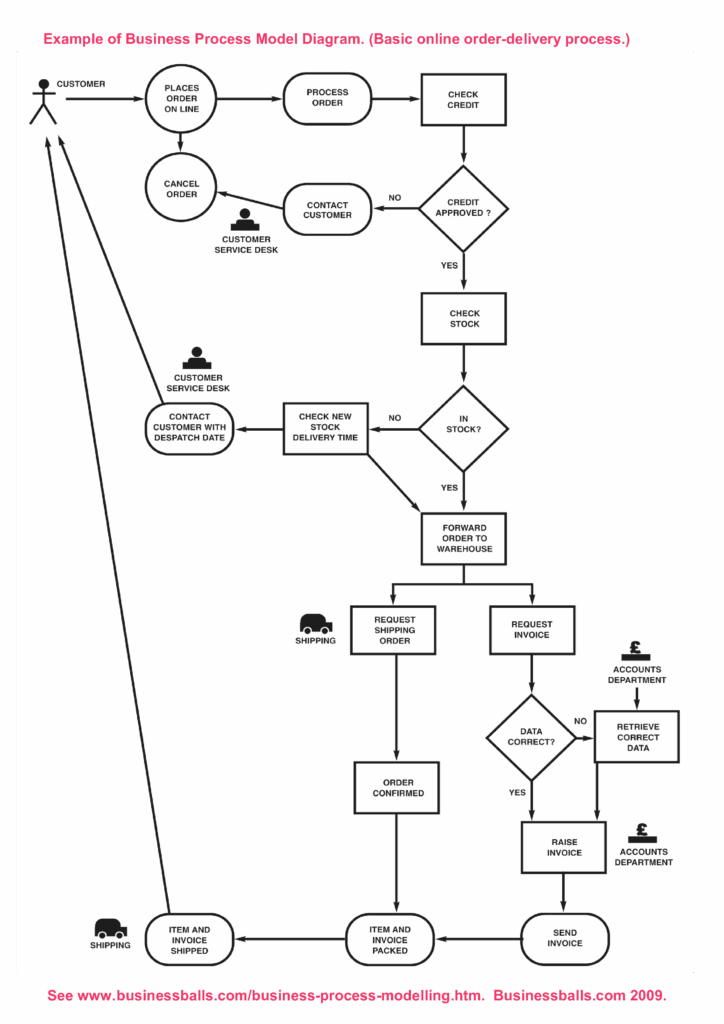
A flow process chart is a visual representation of a process or workflow. It shows the steps involved in completing a task or project, highlighting the sequence of activities and decision points along the way. Flow process charts are commonly used in business process improvement, project management, and manufacturing to streamline operations and increase efficiency.
For example, a flow process chart for a manufacturing process might include steps such as receiving raw materials, production, quality control, packaging, and shipping. Each step is represented by a symbol or shape, such as a rectangle for a task, a diamond for a decision point, or an arrow for the flow of work.
Flow Process Chart Example
How to Create a Flow Process Chart
Creating a flow process chart involves identifying the steps in a process, determining the sequence of activities, and mapping out the flow of work. Here’s a simple example of a flow process chart for a project management process:
- Define project scope (rectangle)
- Create project plan (rectangle)
- Assign tasks to team members (rectangle)
- Monitor progress (rectangle)
- Review and adjust plan (diamond)
- Complete project (rectangle)
By following these steps and using symbols to represent each task, decision point, or flow of work, you can create a clear and organized flow process chart that helps visualize the entire process from start to finish.
