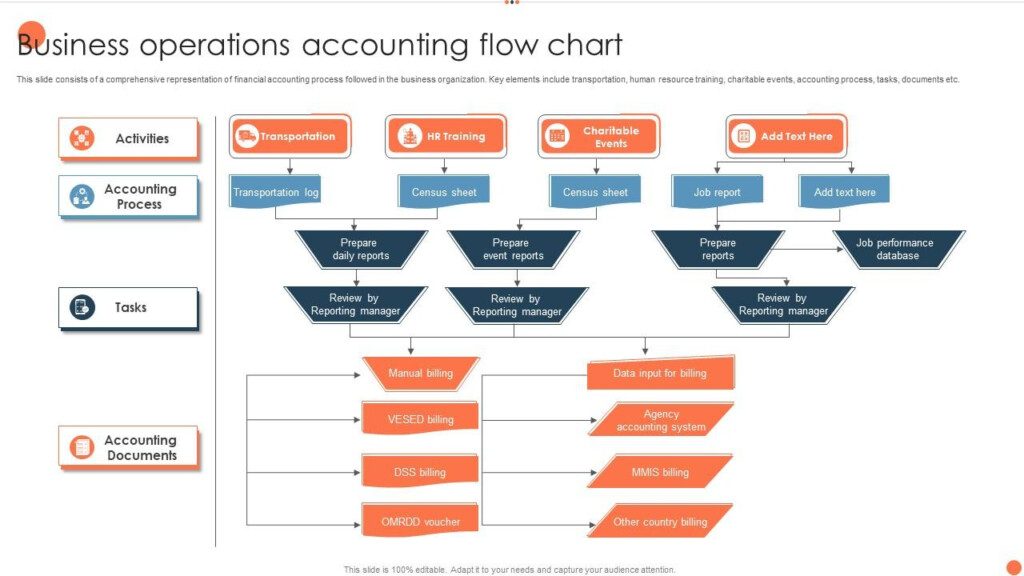
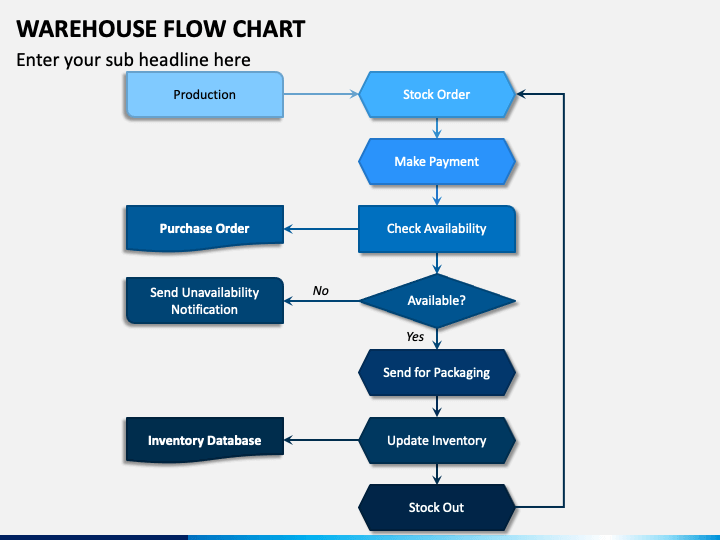
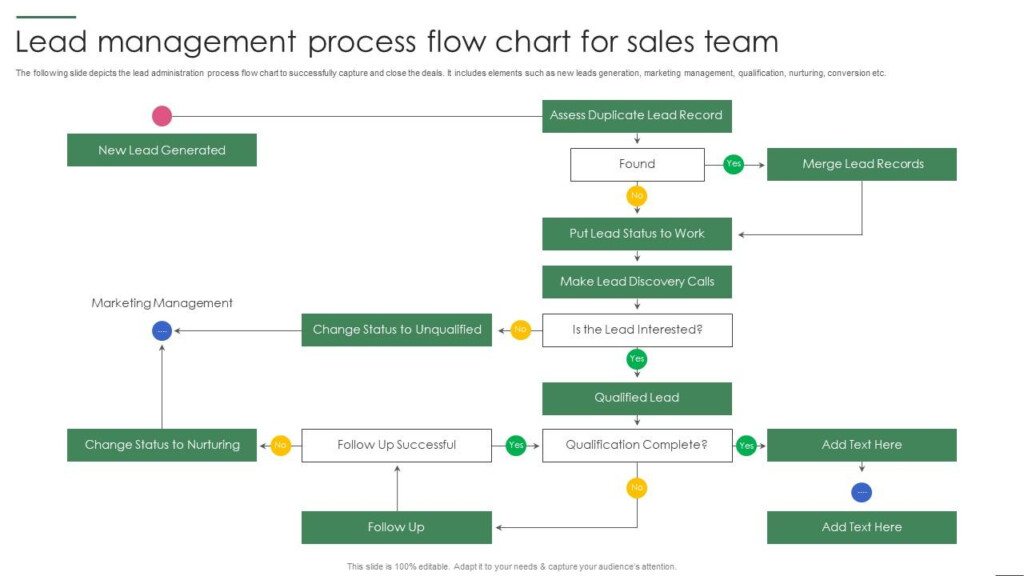
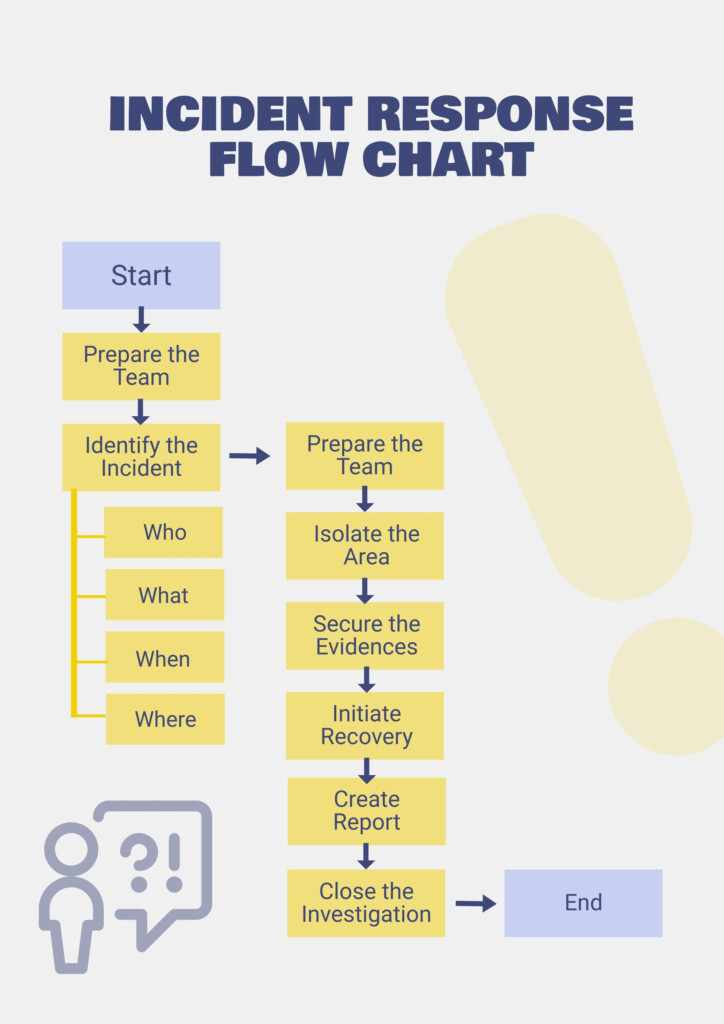
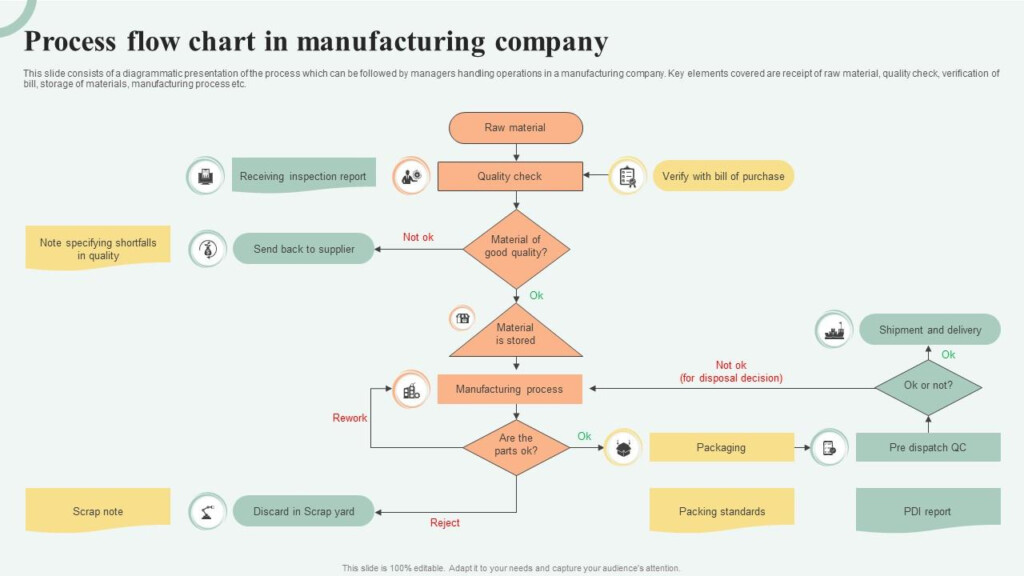
A flow process chart is a tool used in operations management to visually represent the steps involved in a process or workflow. It provides a clear and concise overview of how tasks are carried out, highlighting the sequence of activities, decision points, and potential bottlenecks. By using symbols and arrows to connect each step, flow process charts help teams identify areas for improvement and streamline processes for increased efficiency.
Flow process charts are commonly used in industries such as manufacturing, healthcare, and customer service to map out procedures, standardize operations, and enhance productivity. They are a valuable resource for managers and employees alike, offering a visual way to communicate complex processes and identify opportunities for optimization.
Flow Process Chart In Operations Management
Benefits of Using Flow Process Charts
There are several benefits to using flow process charts in operations management. Firstly, they provide a clear and structured representation of a process, making it easier for teams to understand how tasks are interconnected and where potential issues may arise. This visual clarity can help improve communication and collaboration among team members, leading to smoother operations and better outcomes.
Secondly, flow process charts can help identify inefficiencies and bottlenecks in a process, allowing teams to pinpoint areas for improvement and implement changes that streamline operations. By visualizing the flow of work, managers can see where delays occur, where resources are underutilized, and where tasks can be reorganized for greater efficiency.
How to Create a Flow Process Chart
Creating a flow process chart involves several steps. First, identify the process you want to map out and gather information about each step involved. Next, determine the symbols you will use to represent different activities, such as a rectangle for a task, a diamond for a decision point, or an arrow for the flow of work.
Once you have your symbols in place, start drawing your flow process chart, connecting each step with arrows to show the sequence of activities. Be sure to include any decision points or branches in the process, indicating where different paths may be taken based on specific criteria. Finally, review your flow process chart with your team to ensure accuracy and completeness, making any necessary revisions before finalizing the document.
Overall, flow process charts are a valuable tool in operations management, providing a visual representation of processes that can help teams streamline operations, improve efficiency, and achieve better results.
Download Flow Process Chart In Operations Management
Spare Parts Management Process Flow Chart Ppt Reviewmotors co
Lead Management Process Flow Chart Image To U
Incident Management Process Flow Chart In Illustrator PDF Download
Cosmetic Manufacturing Process Flow Chart Ppt Infoupdate
