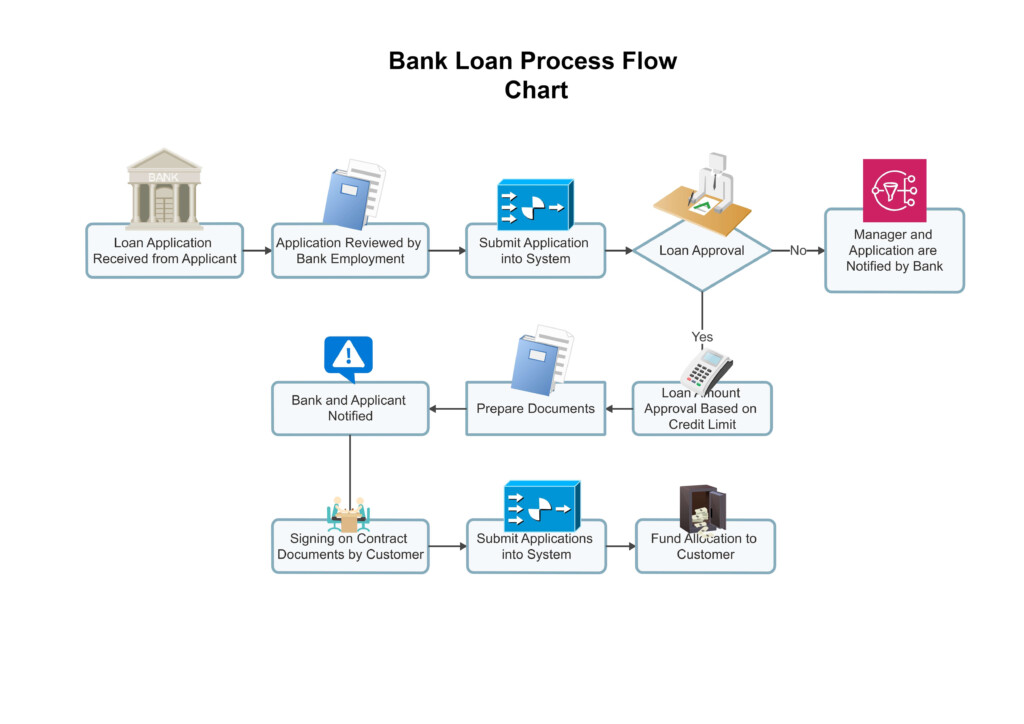
Forecasting is a crucial aspect of any business as it helps in predicting future trends and making informed decisions. A forecasting process flow chart is a visual representation of the steps involved in forecasting, which can help businesses streamline their forecasting process and improve accuracy.
By following a structured forecasting process flow chart, businesses can identify key factors that influence their forecasts, such as historical data, market trends, and external factors. This can help in developing more accurate and reliable forecasts, leading to better decision-making and improved business performance.
Forecasting Process Flow Chart
Components of a Forecasting Process Flow Chart
A typical forecasting process flow chart consists of several key components that outline the steps involved in the forecasting process. These components may include:
- Data Collection: Gathering relevant data from internal and external sources.
- Data Analysis: Analyzing the data to identify patterns and trends.
- Model Development: Building forecasting models based on the data analysis.
- Forecast Generation: Generating forecasts based on the developed models.
- Evaluation and Review: Evaluating the accuracy of forecasts and reviewing the forecasting process.
Each component plays a crucial role in the forecasting process, and a well-designed flow chart can help businesses visualize the entire process from start to finish.
Benefits of Using a Forecasting Process Flow Chart
There are several benefits to using a forecasting process flow chart in business forecasting:
- Improved Clarity: A flow chart provides a clear visual representation of the forecasting process, making it easier for stakeholders to understand and follow.
- Efficiency: By following a structured flow chart, businesses can streamline their forecasting process and reduce the time and effort required for forecasting.
- Consistency: A flow chart helps in standardizing the forecasting process, ensuring consistency in forecasting methods and results.
- Accuracy: By following a well-defined process outlined in a flow chart, businesses can improve the accuracy of their forecasts and make more informed decisions.
In conclusion, a forecasting process flow chart is a valuable tool for businesses looking to enhance their forecasting capabilities and improve decision-making. By following a structured flow chart, businesses can streamline their forecasting process, improve accuracy, and achieve better business outcomes.
