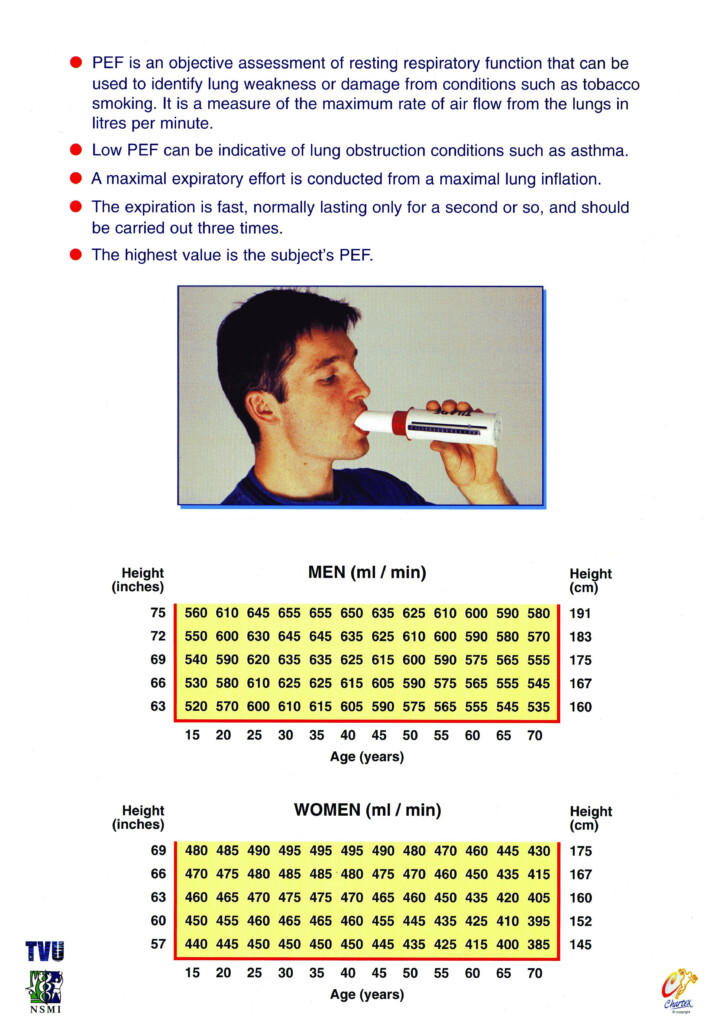
A peak flow measurement chart is a simple yet effective tool used to monitor lung function in individuals with asthma or other respiratory conditions. It measures the maximum speed at which a person can exhale air from their lungs, known as peak expiratory flow rate (PEF). By regularly tracking PEF values using a peak flow measurement chart, patients and healthcare providers can assess the severity of airway obstruction and adjust treatment plans accordingly.
Peak flow measurement charts typically consist of a series of numbers representing different PEF levels, ranging from green (good) to yellow (caution) to red (danger). Patients are instructed to blow into a peak flow meter, a handheld device that measures PEF, and record their results on the chart. By comparing their PEF values to the color-coded zones on the chart, patients can determine if their lung function is stable, worsening, or improving.
Peak Flow Measurement Chart
How to Use a Peak Flow Measurement Chart?
Using a peak flow measurement chart is a straightforward process that can be done at home or in a healthcare setting. To get started, patients should first establish their personal best peak flow measurement by recording their highest PEF value over a two-week period when their asthma is well-controlled. This value serves as a baseline for comparison.
Once the personal best peak flow measurement is determined, patients can then use the peak flow meter to measure their PEF on a daily basis, preferably in the morning before taking any asthma medications. The recorded values can be plotted on the peak flow measurement chart to track changes in lung function over time. If PEF values fall into the yellow or red zones, patients should follow their asthma action plan and seek medical attention if necessary.
The Importance of Regular Monitoring
Regular monitoring of peak flow measurements is crucial for managing asthma and other respiratory conditions effectively. By tracking changes in PEF values, patients can identify early signs of worsening lung function and take proactive measures to prevent asthma attacks or exacerbations. Healthcare providers can also use peak flow measurement data to adjust medication dosages, assess treatment efficacy, and optimize patient care.
In conclusion, a peak flow measurement chart is a valuable tool for monitoring lung function and managing respiratory conditions such as asthma. By incorporating regular peak flow measurements into their daily routine, patients can gain valuable insights into their lung health and work collaboratively with healthcare providers to achieve optimal respiratory outcomes.
